Table 18–18, Jvm statistics for java se- compilation, Table 18–19 – Sun Microsystems GLASSFISH ENTERPRISE 820433510 User Manual
Page 188: Jvm statistics for java se- garbage collection, Table 18–20, Jvm statistics for java se- memory
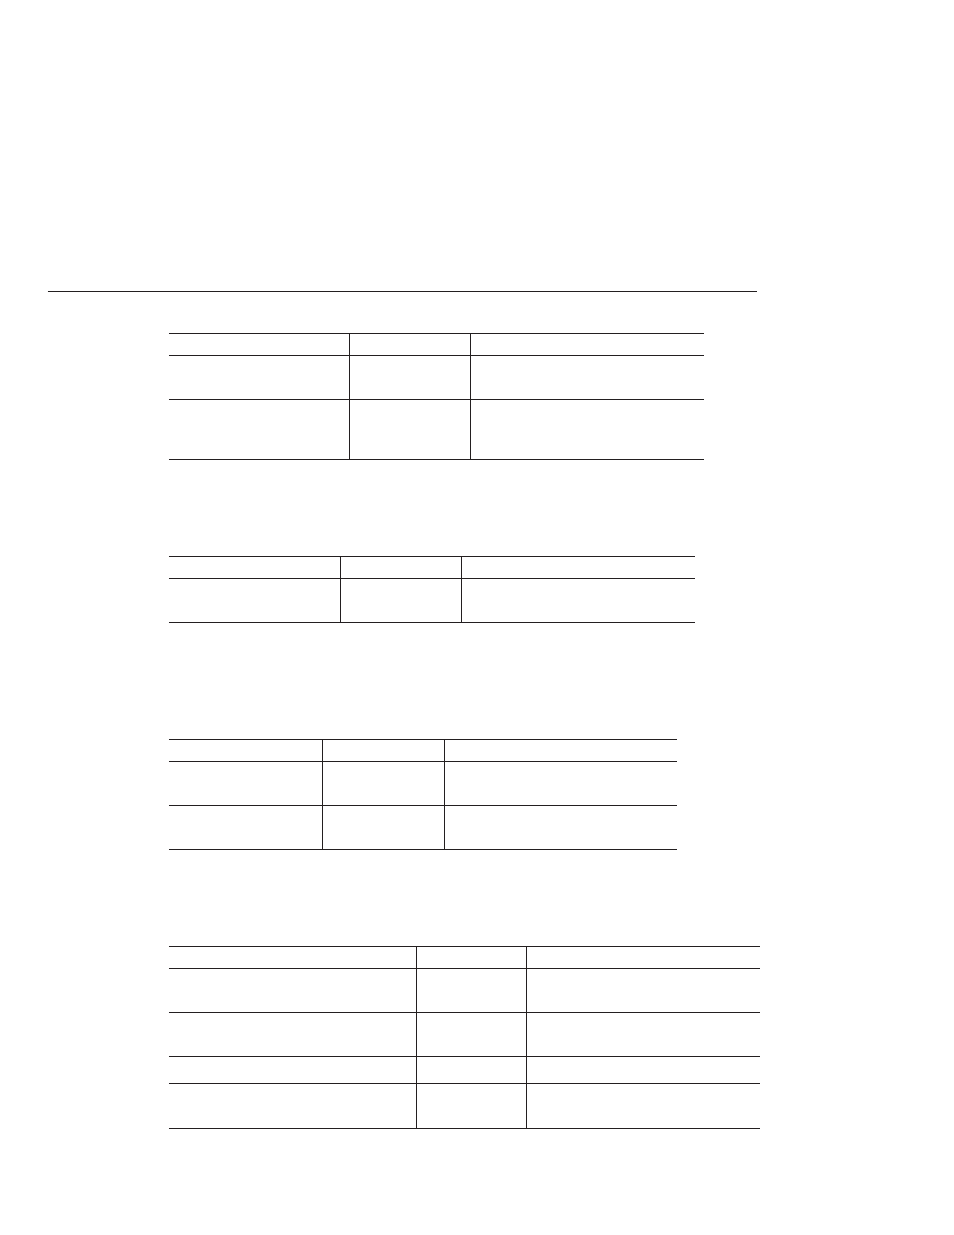
TABLE 18–17
JVM Statistics for Java SE- Class Loading
(Continued)
Statistic
Data Type
Description
totalloadedclasscount
CountStatistic
Total number of classes that have been
loaded since the JVM began execution.
unloadedclasscount
CountStatistic
Number of classes that have been
unloaded from the JVM since the JVM
began execution.
The statistics available for compilation in the JVM in Java SE are shown in the following table.
TABLE 18–18
JVM Statistics for Java SE- Compilation
Statistic
Data Type
Description
totalcompilationtime
CountStatistic
Accumulated time (in milliseconds) spent
in compilation.
The statistics available for garbage collection in the JVM in Java SE are shown in the following
table.
TABLE 18–19
JVM Statistics for Java SE- Garbage Collection
Statistic
Data Type
Description
collectioncount
CountStatistic
Total number of collections that have
occurred.
collectiontime
CountStatistic
Accumulated collection time (in
milliseconds).
The statistics available for memory in the JVM in Java SE are shown in the following table.
TABLE 18–20
JVM Statistics for Java SE- Memory
Statistic
Data Type
Description
objectpendingfinalizationcount
CountStatistic
Approximate number of objects that are
pending finalization.
initheapsize
CountStatistic
Size of the heap initially requested by the
JVM.
usedheapsize
CountStatistic
Size of the heap currently in use.
maxheapsize
CountStatistic
Maximum amount of memory (in bytes)
that can be used for memory management.
About Monitoring
Sun GlassFish Enterprise Server 2.1 Administration Guide • December 2008
188