Ion Science Cub User Manual
Page 29

CUB MANUAL
Ion Science Ltd
Page 29 of 42
Unrivalled Detection. www.ionscience.com
CubPC software
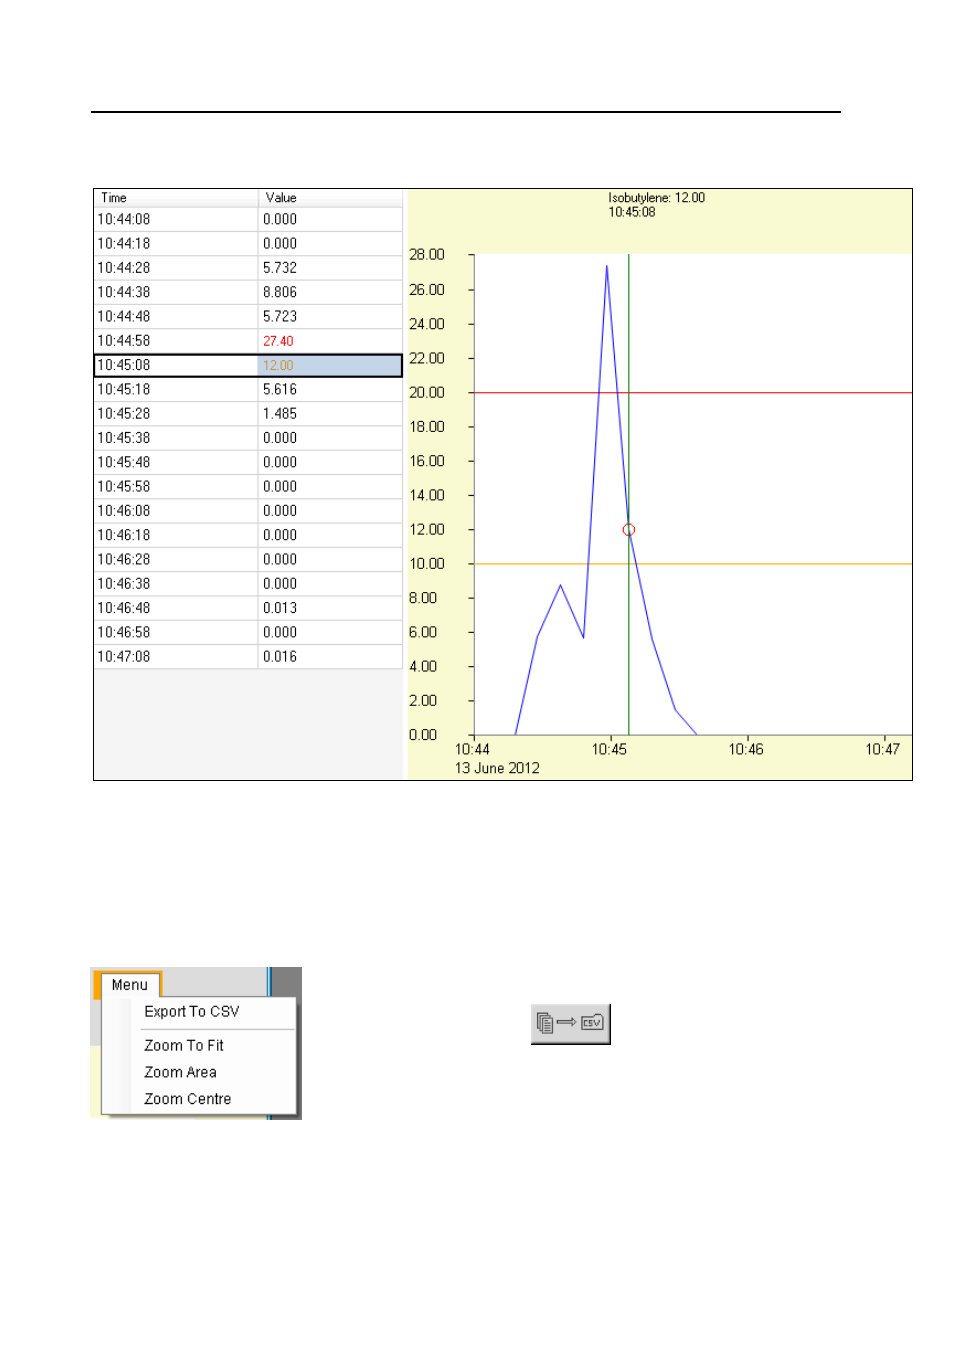
If the table of readings is clicked on, a vertical green line is added to the graph to indicate the time of the
reading. For example:
Above the line, the gas level at that time and exact time of the reading are displayed.
A green reading indicator line is also displayed if the graph is clicked on. The line will be displayed for the
reading closest to the point that the graph was clicked.
Zoom into the graph by placing the cursor at the point that is to be zoomed into and rolling the mouse wheel
down. Roll the mouse wheel up or press the right mouse button to zoom out.
Pressing the orange Menu button displays the following options:
The Export to CSV option is used to export the log data to a CSV file. This
works in the same way as the
button on the data log overview
page (see Saving Logged Data to a CSV File above).
The Zoom to Fit option is used to change the zoom level so that the entire
graph is displayed at once (the graphs are displayed like this by default).
