Viewing details of logged data – Ion Science Cub User Manual
Page 28
CUB MANUAL
Ion Science Ltd
Page 28 of 42
Unrivalled Detection. www.ionscience.com
CubPC software
Note that logged data may automatically be saved to a CSV when a Cub is connected to a docking station,
depending on the options selected on the Preferences page.
Viewing Details of Logged Data
To view details of a data log, press this button in the Data log column for the log in question:
.
To view details of the most recent data log recorded by a Cub, press the same button on the Cubs page for
the Cub in question.
The number on the button indicates how many files are stored within the Cub.
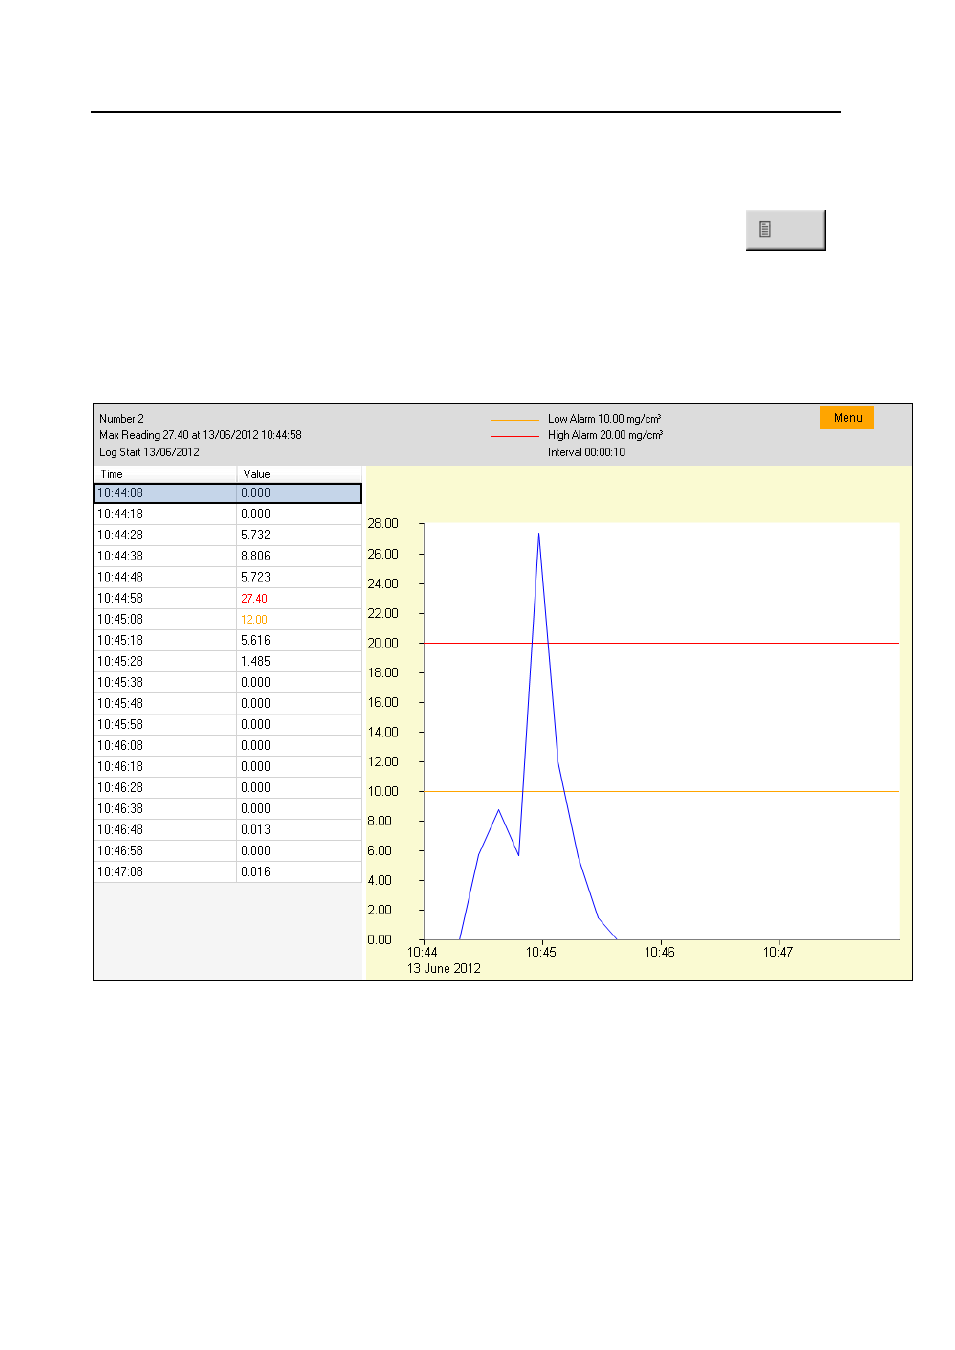
The details of the reading recorded in the selected log are then displayed. For example:
The log details page is divided into three areas.
The top area displays the following general details of the log: the name of the Cub, the maximum reading
and when it was detected, when the log started, and the low alarm level, high alarm level and interval
between readings set for the Cub (see Configuring a Cub above).
The left-hand area lists the time and recorded gas level of each reading. A reading value displayed in red
indicates that the reading would have triggered a high level alarm. A reading value displayed in orange
indicates that the reading would have triggered a low level alarm.
The right-hand area displays a line graph of the readings. The time is displayed along the X-axis. Gas levels
are displayed along the Y-axis. The blue line indicates the recorded gas level. The red and orange lines
indicate the high and low alarm levels respectively.