Chart, Chart 40 – Ensemble Designs 7555 HD / SD Video Processing Frame Synchronizer User Manual
Page 40

www.ensembledesigns.com
Avenue 7555, 9550, 9550-XA - Page 40
7555 HD/SD, 9550 3G/HD/SD, and 9550-XA 3G/HD/SD Video Processing Frame Synchronizers
Aud AGC Chart
Chart
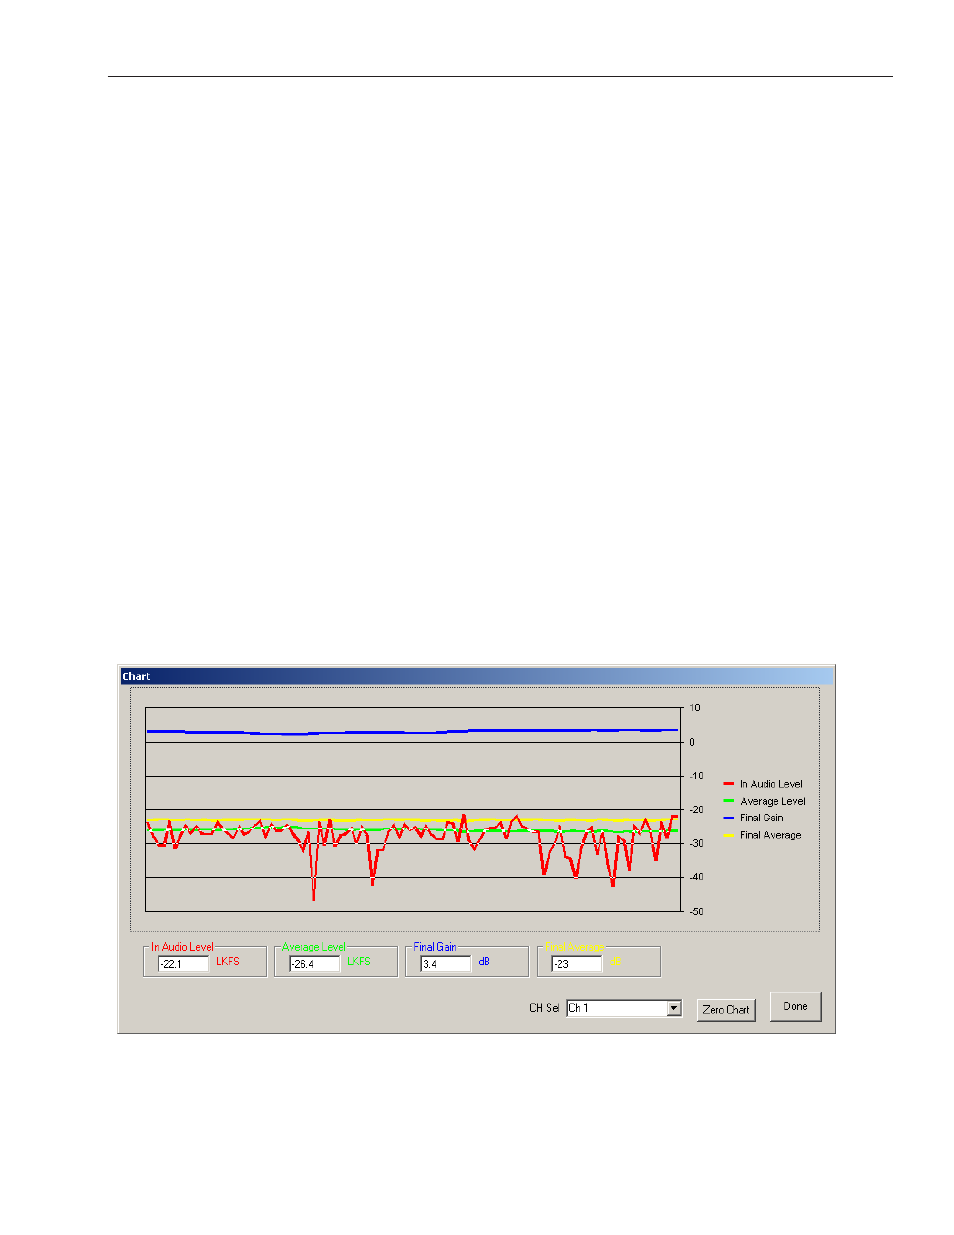
Click the Chart button to view a visual representation of AGC behavior on a channel-by-channel basis.
The chart represents the most recent two-minute span of time for analysis performed on the channel
selected in the CH Sel drop-down menu.
• In Audio Level (red line): The red line represents the level of the audio signal as it enters the
Avenue module, prior to being processed by AGC.
• Average Level (green line): The green line represents an averaging of the incoming audio signal
level.
• Final Gain (blue line): The blue line represents the Final Gain expressed in terms of decibels (dB).
This shows how much the AGC is adjusting the level of the audio signal based on the configuration
parameters specified in the Aud AGC menu.
• Final Average (yellow line): The yellow line represents the final corrected output, calculated from
the Average Level and the Final Gain. The yellow line reflects manual adjustments made to the
gain level on the mixer for the channel being charted, provided that the Meter Position is set to
Post on the Aud Cfg menu.
• CH Sel drop-down menu: LevelTrack Loudness Control automatically monitors the levels in up to
16 audio channels. From the drop-down menu, select the channel for which you want to view the
LevelTrack Loudness Control AGC behavior.
Note:
The Chart’s graph lines remain active as long as you are looking at the corresponding
module on Avenue PC. However, if you keep the chart window open, and then select
a different Avenue module through Avenue PC, the chart’s graph lines will go flat.
AGC is still active, however, until it is turned off in the AGC Master drop-down menu.
