Viewing sample values – Measurement Computing WiFi-500 Sensor Series User Manual
Page 29

WiFi-500 Sensor Series User's Guide
Exporting a graph to PDF (Personal and Professional accounts only)
29
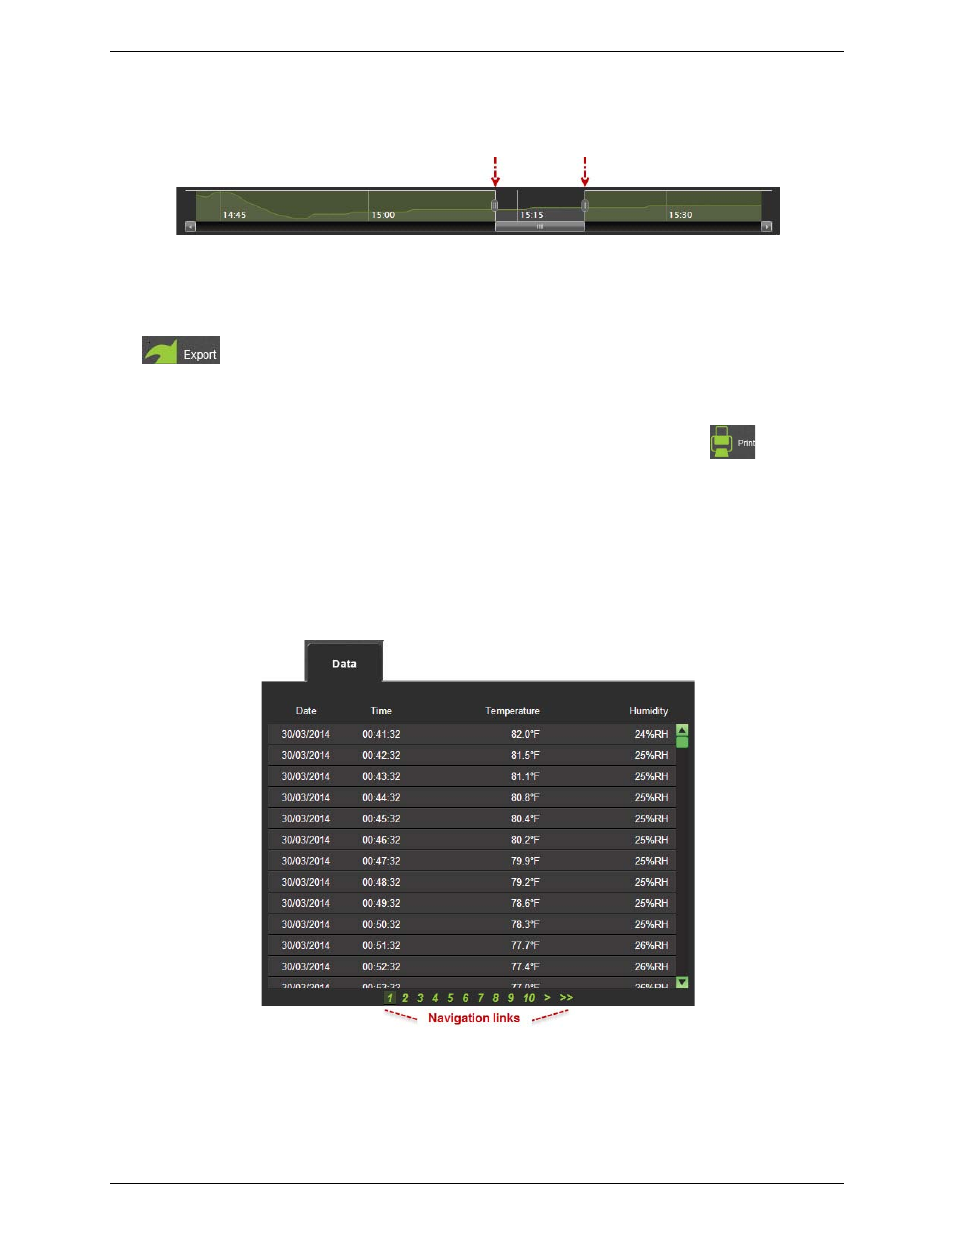
Click-and-drag the date/time range controls connected to scroll bar to narrow the range of data to a select date
and time.
Figure 27: Date/time range controls
Exporting a graph to PDF (Personal and Professional accounts only)
Personal and Professional Cloud account users can export an image of the graph to a
by clicking
. with the Graph tab displayed.
Printing a graph (Personal and Professional accounts only)
Personal and Professional Cloud account users can print an image of the graph by clicking
.
Viewing sample values
To view the value of each sample from a logging session on the
Sensor Session Data
page, complete the
following steps:
1. Log in to your Cloud account and select
View Devices»On The Cloud
in the main software screen
2. Select the active device in the
Devices
page and click
View Data
.
3. Click on the
Data
tab.
Figure 28: Data listed on Sensor Session Data - Data tab
Each sample is listed on the
Data
tab. Use the green navigation links below the listing to browse through data in
the session.
