Viewing graphed data, Graph display options – Measurement Computing WiFi-500 Sensor Series User Manual
Page 28
WiFi-500 Sensor Series User's Guide
Viewing graphed data
28
Viewing graphed data
Complete the following steps to view graphed data for a specific logging session on the Cloud:
1. Log in to your Cloud account and select
View Devices»On The Cloud
in the main software screen.
2. Select the active device in the
Devices
page and click
View Data
.
3. Click on the
Graph
tab
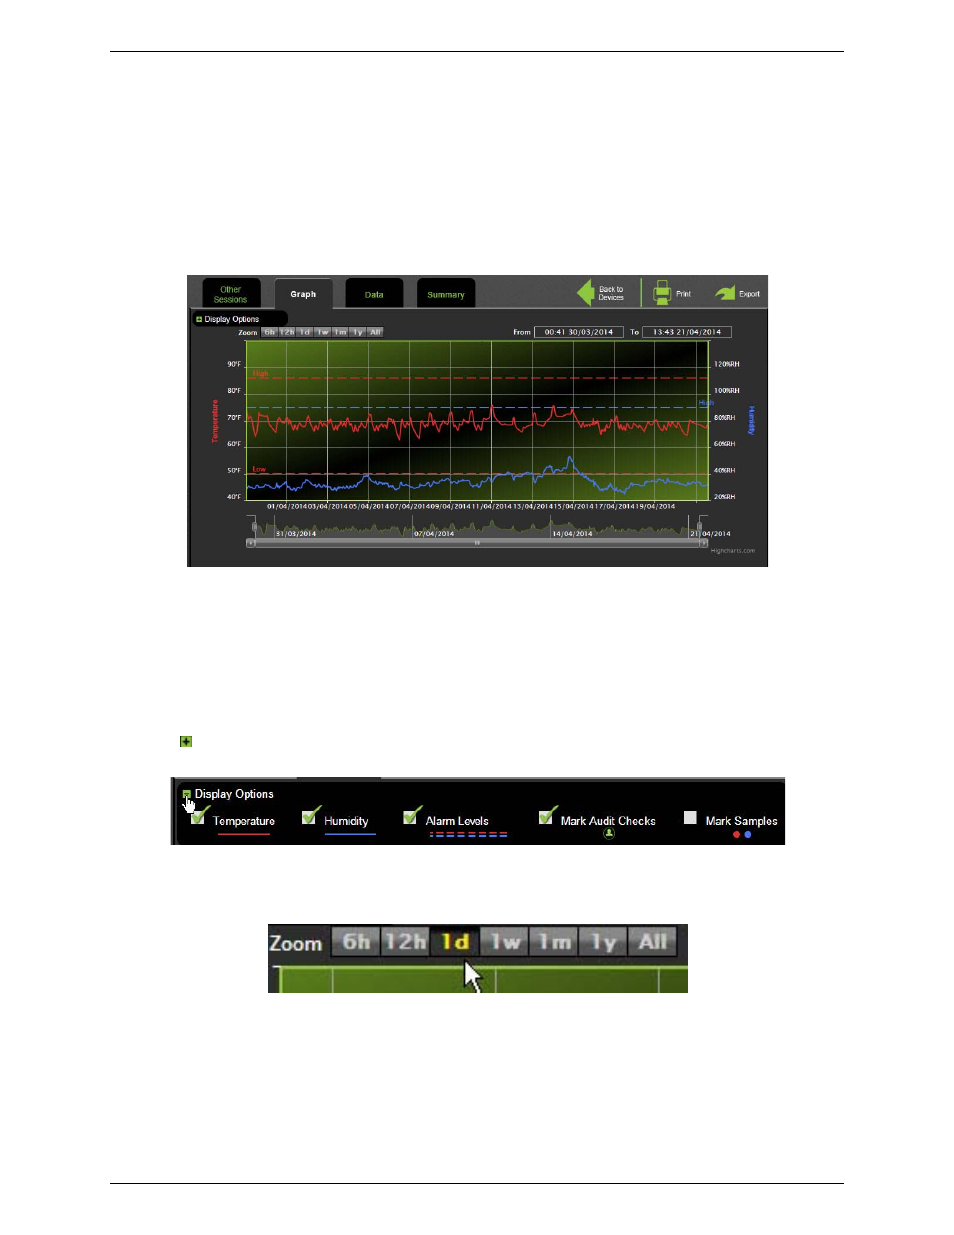
Figure 24: Data plotted on Sensor Session Data - Graph tab
The
Graph
tab on the
Sensor Session Data
page displays the following information:
o
temperature readings
o
relative humidity readings (if supported)
o
high/low alarm levels (if configured)
Graph display options
Click
Display Options
to view or hide temperature readings, humidity readings, alarm levels, audit checks,
and to mark samples.
Figure 25: Display Options for Cloud graph
Depending on the time range of the data acquired in the session, you can use the
Zoom
to view graphed data for
a selected time period (6 hours, 12 hours, 1 day, 1 week, 1 month, 1 year, or all samples).
Figure 26: Zoom Options for Cloud graph