Graph viewing options, Creating and viewing data files, Saving all data to a .csv file – Measurement Computing WiFi-500 Sensor Series User Manual
Page 15: Saving a portion of data to a .csv file
WiFi-500 Sensor Series User's Guide
Graph viewing options
15
Graph viewing options
The
View
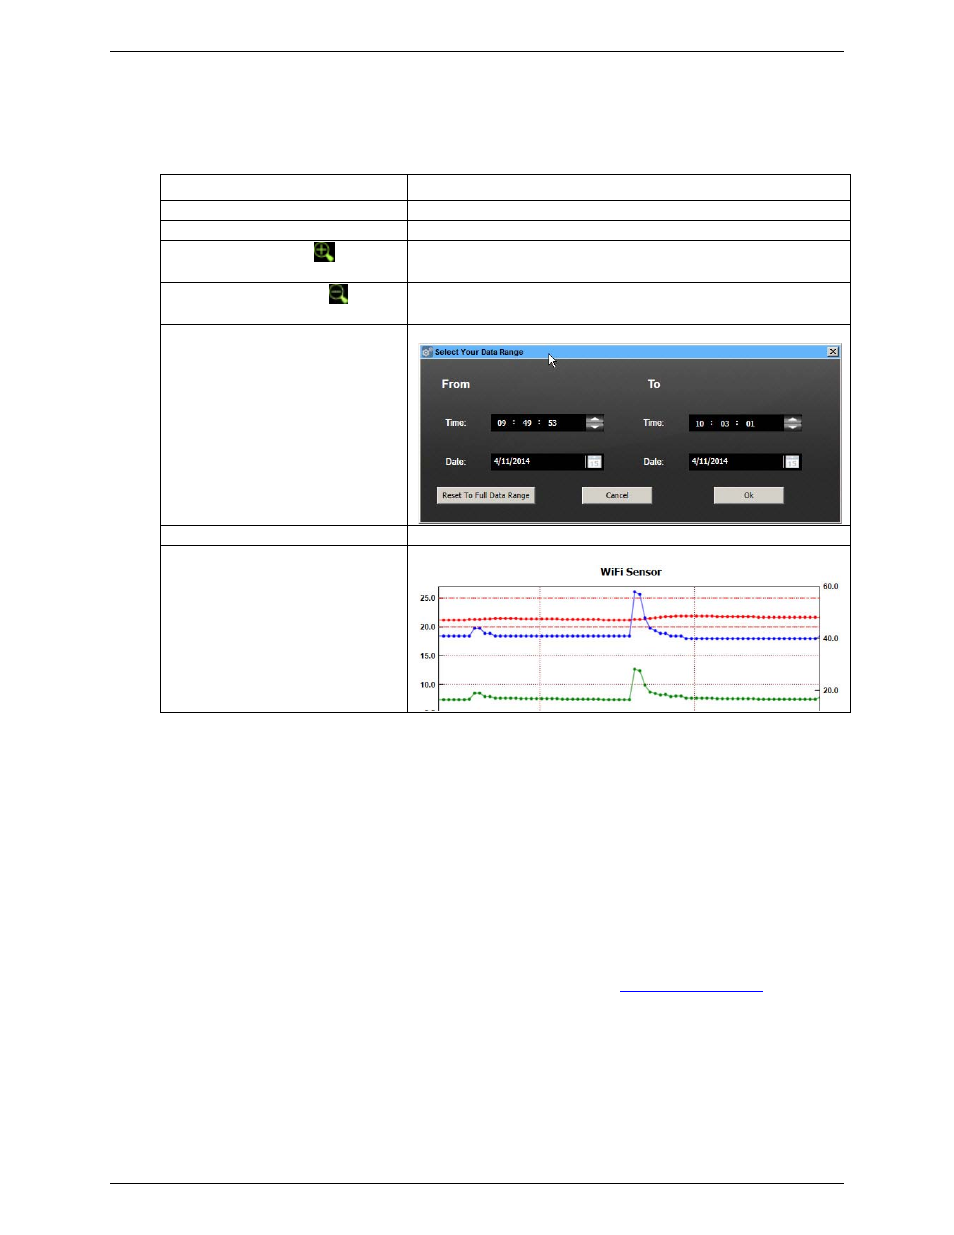
menu and toolbar The graph includes the following viewing options
:
View menu option/toolbar icon
Function
View»Toolbar
Display or hide the toolbar at the top of the graph.
View»Status Bar
Display or hide the status bar at the bottom of the graph
View»Zoom In or click
on the
toolbar
Zoom in to view a narrower range of graph data.
View»Zoom Out or click
on the
toolbar
Zoom out to view a wider range of graph data.
View»Data Range
Enter a time/date range of data to view on the graph.
View»Gridlines
Display or hide X-axis and Y-axis gridlines on the graph.
View»Mark Samples
Adds a small circle to the plot line to indicate each sample.
Creating and viewing data files
You can export logged data and graph images to different file formats, and open them for viewing and analysis.
Saving all data to a .csv file
Complete the following steps to save all logged data to a text file:
1. Click
Save
on the toolbar.
2. Enter a filename and browse for the location to save the file, and click
Save
.
Saving a portion of data to a .csv file
Complete the following steps to save a portion of logged data to a text file:
1. Zoom in on the section of the graph containing the data to save (refer to
Graph viewing options
).
2. Click
Save
on the toolbar.
3. Enter a filename and browse for the location to save the file, and click
Save
.