Measurement Computing WiFi-500 Sensor Series User Manual
Page 14
WiFi-500 Sensor Series User's Guide
Viewing data on the PC
14
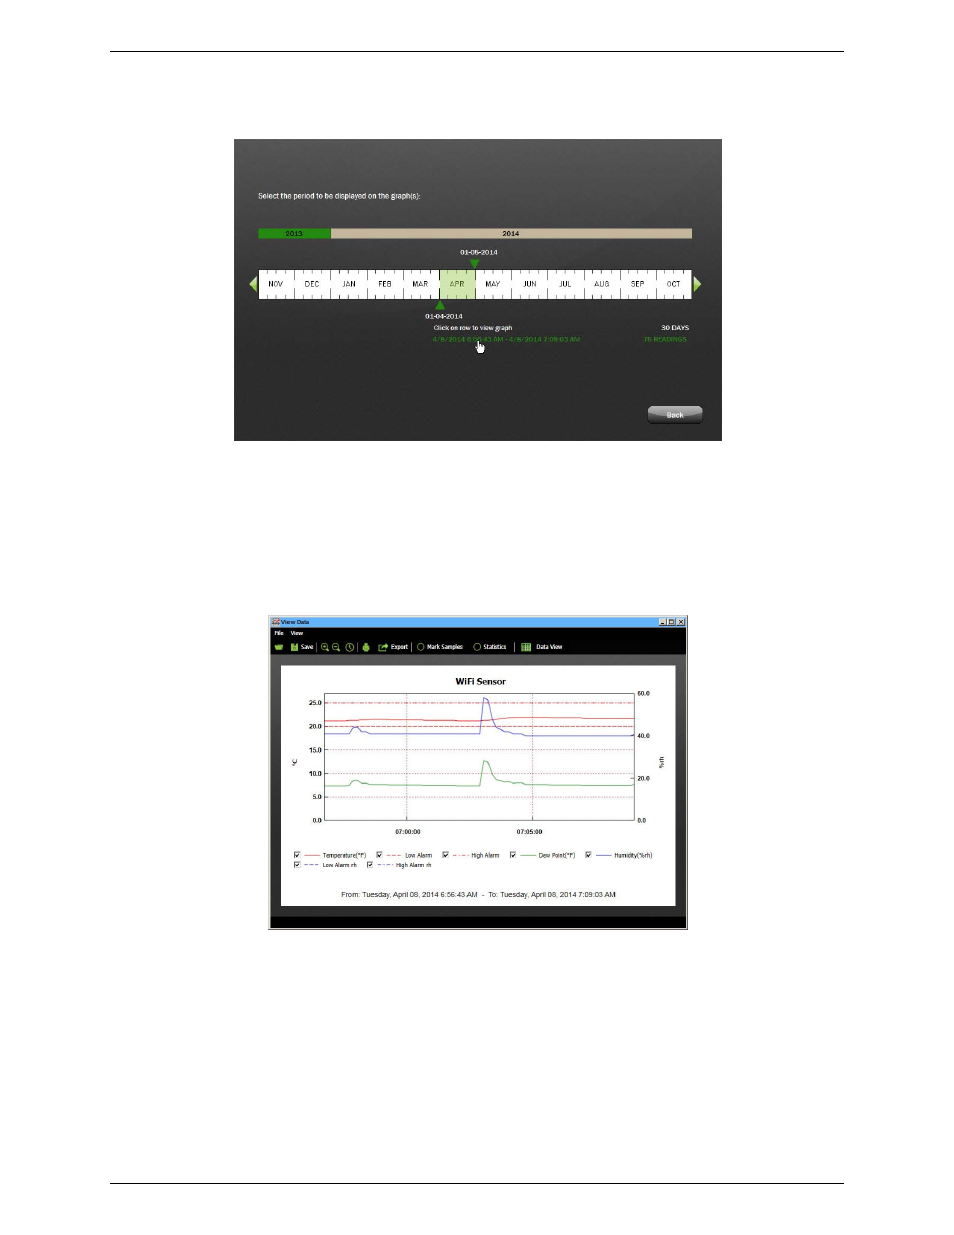
3. Click on the logging session you want to view.
Figure 9: Selecting a logging session
A graph displays with checkboxes to show the following information:
o
temperature readings
o
relative humidity readings (if supported)
o
temperature alarm readings
o
relative humidity alarm readings (if supported)
o
dew point (if supported)
Figure 10: Graph of WiFi-500 sensor data (temperature/humidity example)
See also other documents in the category Measurement Computing Hardware:
- ACC-300 (7 pages)
- AI-EXP32 (20 pages)
- AI-EXP48 (19 pages)
- BTH-1208LS (30 pages)
- 6K-ERB08 (32 pages)
- BTH-1208LS Quick Start (4 pages)
- 6K-SSR-RACK08 (33 pages)
- BTH-1208LS-OEM (27 pages)
- CB-COM-Digital (68 pages)
- CB-7018 (68 pages)
- CB-7000 Utilities (44 pages)
- CB-7080D (74 pages)
- CB-COM-7033 (44 pages)
- CB-COM-7017 (72 pages)
- CB-COM-7024 (76 pages)
- CB-NAP-7000P (36 pages)
- CIO-DAC02/16 (16 pages)
- CIO-DAC02 (18 pages)
- CB-NAP-7000D (56 pages)
- CIO-DAC16-I (16 pages)
- CIO-DAC16/16 (20 pages)
- CIO-DAS08 (21 pages)
- CIO-DAC16 (20 pages)
- CIO-DAS08/JR (16 pages)
- CIO-DAS08/JR/16 (14 pages)
- CIO-DAS08/JR-AO (16 pages)
- CIO-DAS08-AOM (32 pages)
- CIO-DAS08-PGM (28 pages)
- CIO-DAS16/330 (34 pages)
- CIO-DAS48-I (17 pages)
- CIO-DAS16/M1 (38 pages)
- CIO-DAS48-PGA (18 pages)
- CIO-DAS800 (20 pages)
- CIO-DAS802/16 (22 pages)
- CIO-DAS6402/16 (40 pages)
- CIO-DAS-TEMP (20 pages)
- CIO-DDA06/16 (18 pages)
- CIO-DDA06/JR (17 pages)
- CIO-DIO24H (20 pages)
- CIO-DIO24/CTR3 (21 pages)
- CIO-DI192 (24 pages)
- CIO-DDA06 (21 pages)
- CIO-DIO48 (19 pages)
- CIO-DO192H (16 pages)
- CIO-DIO192 (20 pages)