Hoefer SP-2001 Vision Life Spectrophotometer User Manual
Page 37
Version 1.0
Page 37
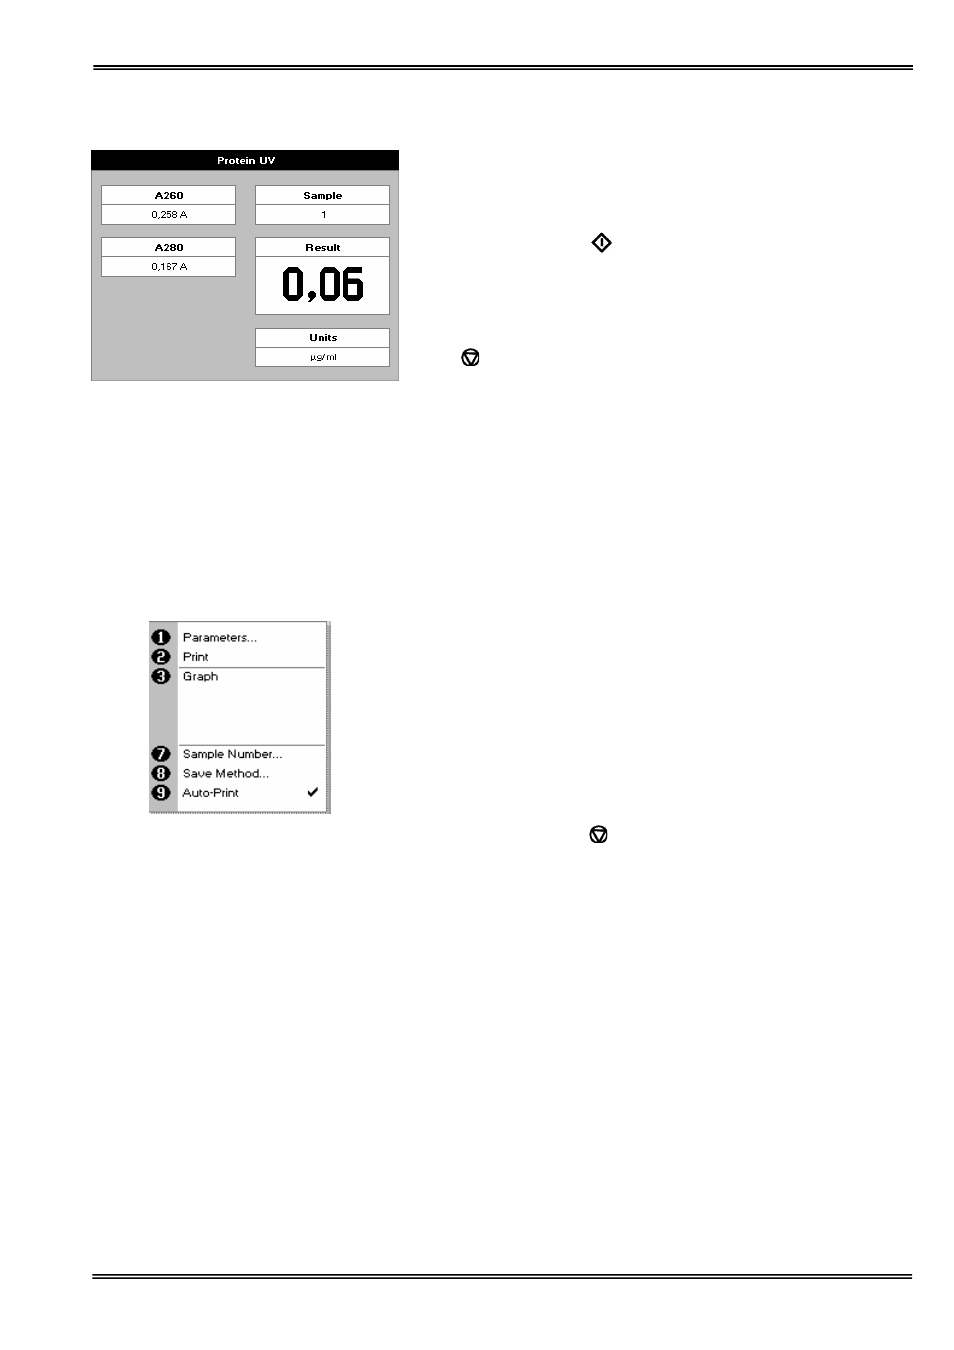
Results Screen
Step 9
Insert the reference. Press 0A/100%T Key. This will be used for
all subsequent samples until changed.
Step 10
Insert sample and press
. This measures at both 260 and 280
nm wavelengths and displays the result. Protein concentration is
calculated (corrected by background wavelength value if
selected).
Repeat step 10 for all samples.
Press
to return to the Protein folder.
Press ::; to display available Options which are described
below.
Options (select using key pad numbers)
1. Return to parameters screen (step 1 above).
2. Print result via selected method.
3. Toggle graph on/off. The graph shows a wavescan plot
across the range 250 nm to 330 nm with cursors denoting
230, 260, 280 and (if background correction selected) 320
nm.
7. Sample number – add a prefix to the sample number and
reset the incrementing number to the desired value.
8. Save method – use the left and right arrows to select a folder
to store in (Favorites/Methods 1-9), press the down arrow
and enter name.
9. Auto-print – toggles auto-print on/off.
Exit options by pressing
, or wait.