Hoefer SP-2001 Vision Life Spectrophotometer User Manual
Page 16
Version 1.0
Page 16
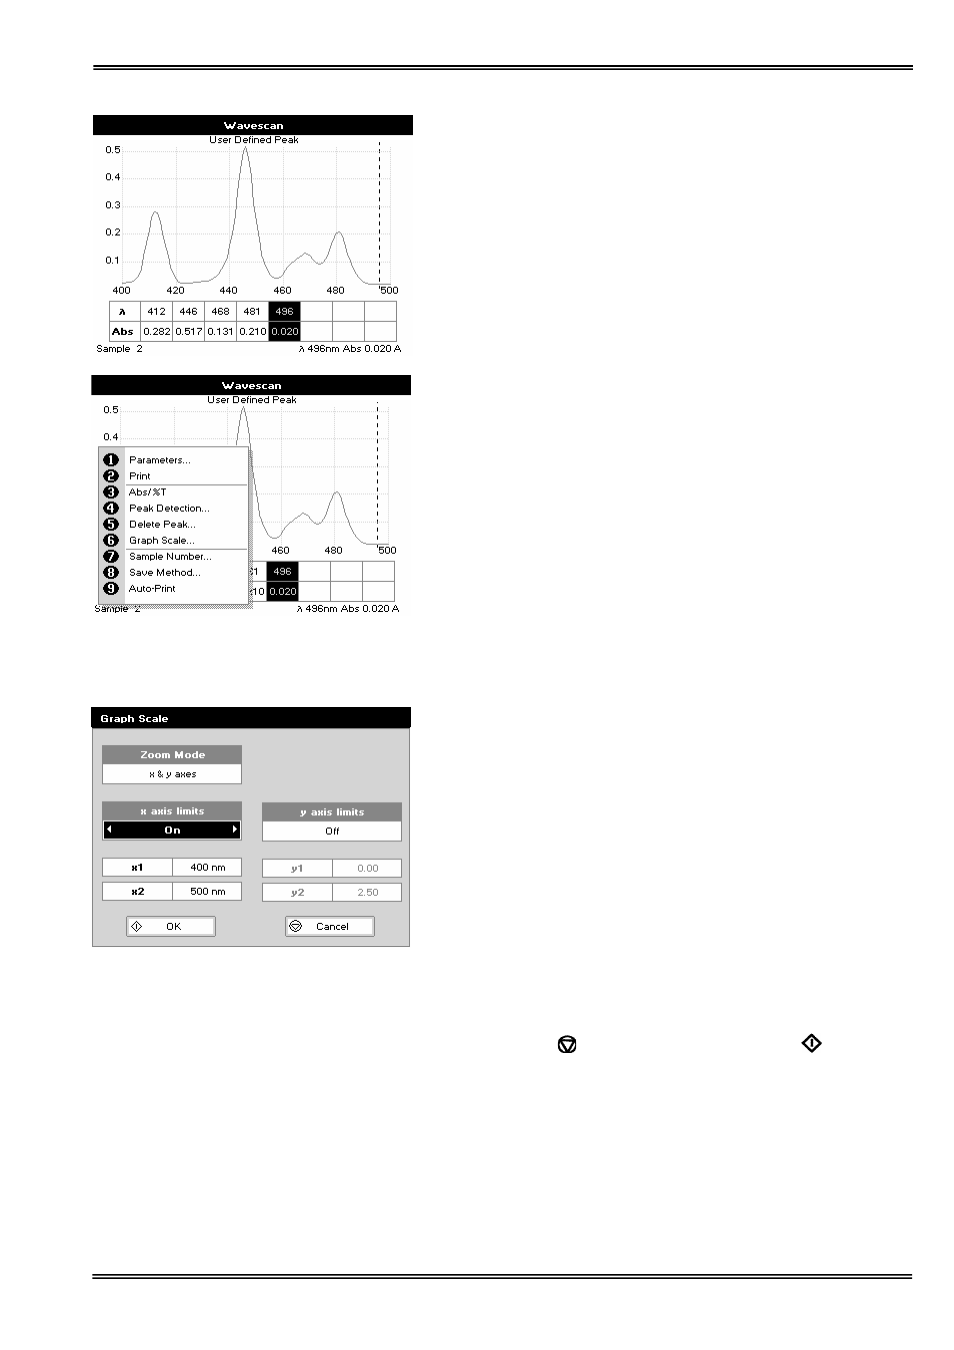
Add Peak... (Shortcut button 5)
Adds a used defined peak at the current cursor position. The
entry is then displayed in inverse coloring to discriminate
between user defined peaks and auto-detect peaks. When the
cursor is positioned over the user defined peak a legend “User
Defined Peak” appears at the top of the graph. The option then
changes to Delete Peak to enable the user to remove the peak.
Note: Storing a method at this stage will save these user defined
wavelengths, each time method is run Absorbance value at
these wavelengths is reported
Graph Scale…
This enables the user to set up a defined graph by defining the
limits in either or both of the x and y axes.
Zoom mode:
This sets up the operation of the Zoom keys (up and down
arrows). “x & y axes” expands the display around the cursor
measurement point, whilst the other options select the
absorbance or wavelength axes respectively. With x or y axis
limits set to on, zooming out will only be permitted to the set
limits.
x/y axis limits:
Setting “x (or y) axis limits” to “On” activates the start and finish
points of the desired graph to user defined specific wavelengths
and/or absorbance values.
Pressing Cancel
ignores the selection; pressing
accepts
them and displays the required graph.