Hoefer SP-2001 Vision Life Spectrophotometer User Manual
Page 18
Version 1.0
Page 18
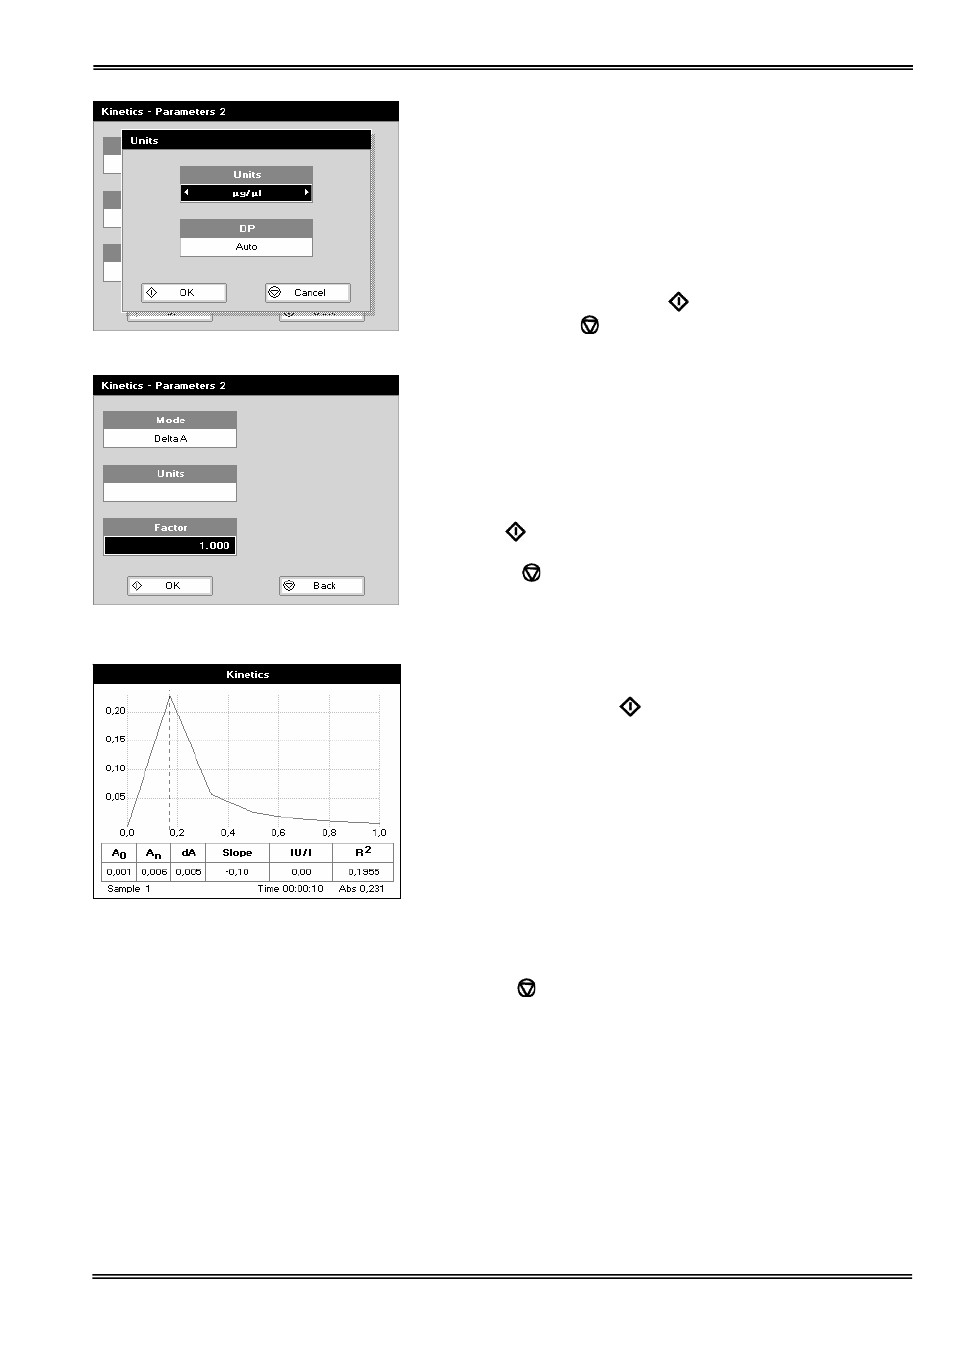
Results
Insert the reference and press the 0A/100%T key.
Insert the sample and press
to start the run.
Time (min) is displayed at the bottom of the screen, and
absorbance data are plotted on the graph as testing proceeds.
The table below the graph gives: Absorbance values at T
0
(start
of calculation), T
n
(finish of calculation, change in absorbance,
slope, regression parameter (R
2
) of the calculated slope and the
result calculated from the selected parameter (dA, final A or
slope).
Use the left and right arrows to move the cursor and display the
time and absorbance value at measured data points.
Use the up and down arrows to zoom in or out.
Press Cancel
to return to the Applications Folder.
Press ::; to display available Options which are described
below.
Step 7
Units: The user can enter a text string up to 8 characters long.
To access a list of pre-defined units press the Options key ::;
and then use the left/right arrows (μg/ml, μg/μl, pmol/μl, mg/dl,
mmol/l, μmol/l, g/l, mg/l, μg/l, U/l, %, ppm, ppb, conc or none).
These units can also be edited once OK is pressed.
This screen also allows the number of displayed decimal points
(DP) to be selected, from 0 to 2 Note that the result will always
be fixed to 5 significant figures regardless of how many decimal
points are selected (so 98768.2 will display as 98768 even with 1
decimal point selected). Press OK
to store the chosen
parameters or Cancel
.
Step 8
Set the Factor by which the result is multiplied to give the
amount in the chosen range using the left and right arrows.
Range of 0.01 to 9999.
Step 9
Press Next
to enter the Results screen
OR
Press Cancel
to return to the Parameters 1 screen.