Hoefer SP-2001 Vision Life Spectrophotometer User Manual
Page 30

Version 1.0
Page 30
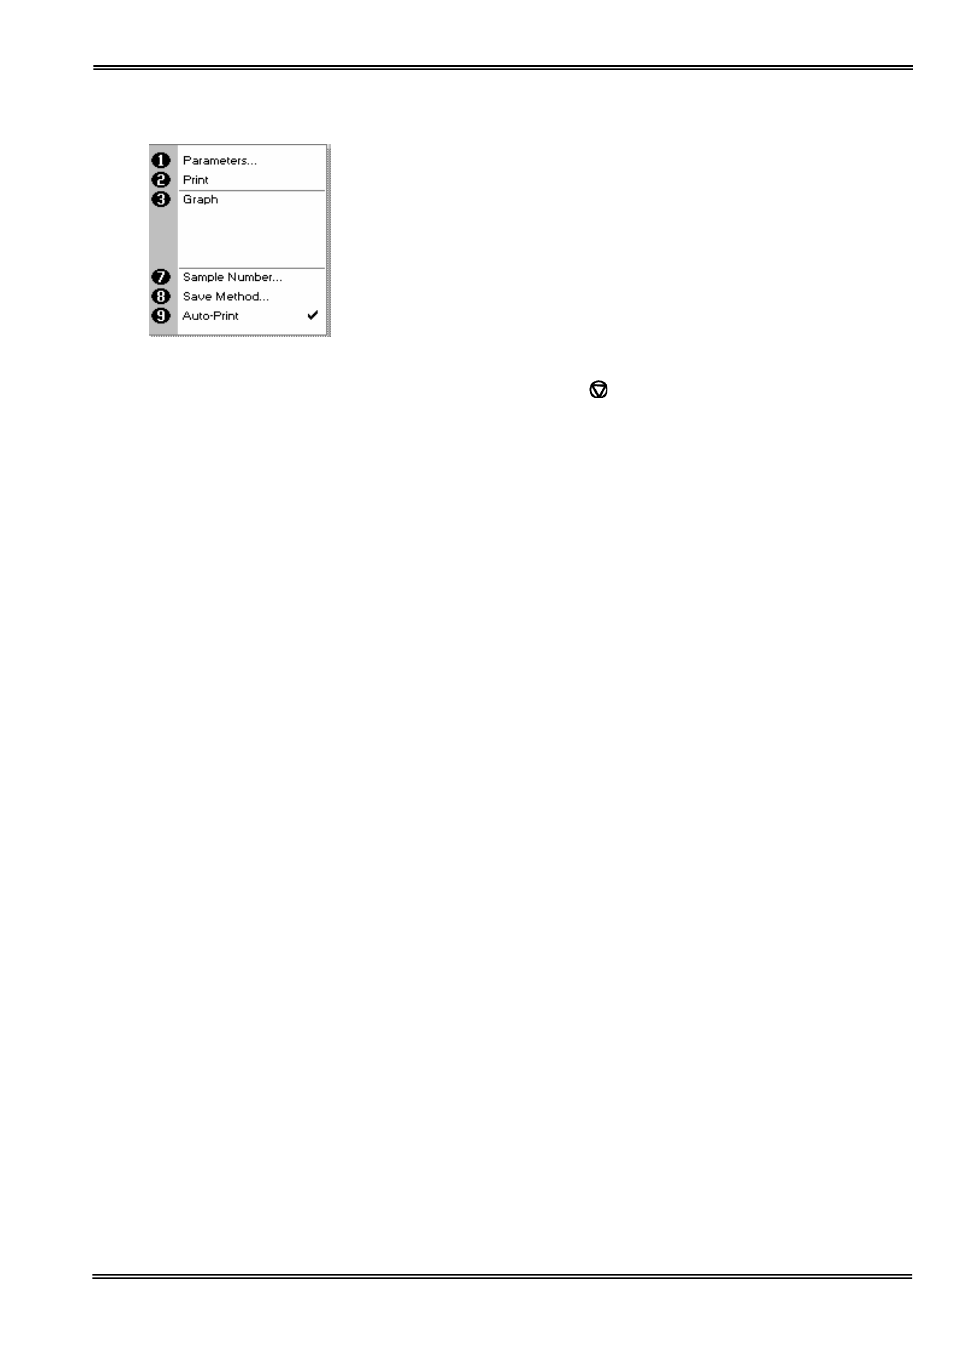
Options (select using key pad numbers)
1. Return to parameters screen (step 1 above).
2. Print result via selected method.
3. Toggle graph on/off. The graph shows a wavescan plot
across the range 220 nm to 320 nm with cursors denoting
230, 260, 280 and (if background correction selected) 320
nm.
7. Sample number – add a prefix to the sample number and
reset the incrementing number to the desired value.
8. Save method – use the left and right arrows to select a folder
to store in (Favorites/Methods 1-9), press the down arrow
and enter name.
9. Auto-print – toggles auto-print on/off.
Exit options by pressing
, or wait.
See also other documents in the category Hoefer Equipment:
- IEF100 (65 pages)
- IEF100 (65 pages)
- SE900 (37 pages)
- SE260 (31 pages)
- SE260 (31 pages)
- SE300 miniVE (37 pages)
- SE300 miniVE (37 pages)
- SE300 miniVE (37 pages)
- SE410 (51 pages)
- SE410 (50 pages)
- SE640 (51 pages)
- SE640 (50 pages)
- SE275 (21 pages)
- SE245 (13 pages)
- SE675 (27 pages)
- SG100 (9 pages)
- SG500 (12 pages)
- SQ33 Sequencer (30 pages)
- SQ33 Sequencer (30 pages)
- SQ33 Sequencer (30 pages)
- HE33 (26 pages)
- HE33 (26 pages)
- HE99X (26 pages)
- HE99X (26 pages)
- HE-PLUS System (26 pages)
- HE-PLUS System (26 pages)
- SUB Series (31 pages)
- SUB Series (31 pages)
- TE70X (31 pages)
- TE70X (31 pages)
- PR648 (11 pages)
- PR150 (9 pages)
- PR645 Immunoblot XL (21 pages)
- TE22 (35 pages)
- TE22 (35 pages)
- TE62 (35 pages)
- TE22 (31 pages)
- DQ300 (30 pages)
- DQ300 (30 pages)
- UVIS20 (21 pages)
- UVIS20 (21 pages)
- Single Channel Variable Pipette (8 pages)
- PR250 (18 pages)
- PP24 (10 pages)
