2 power control simulation, 1 simulation, 2 simulation log – CIRCUTOR MDC-20 User Manual
Page 46: Power, Control, Simulation, Simulation log
MDC-20
Page 46 of 58
User Manual
8.2 POWER CONTROL SIMULATION
The application has a tool that allows the user to check the correct working of their
configuration.
8.2.1 Simulation
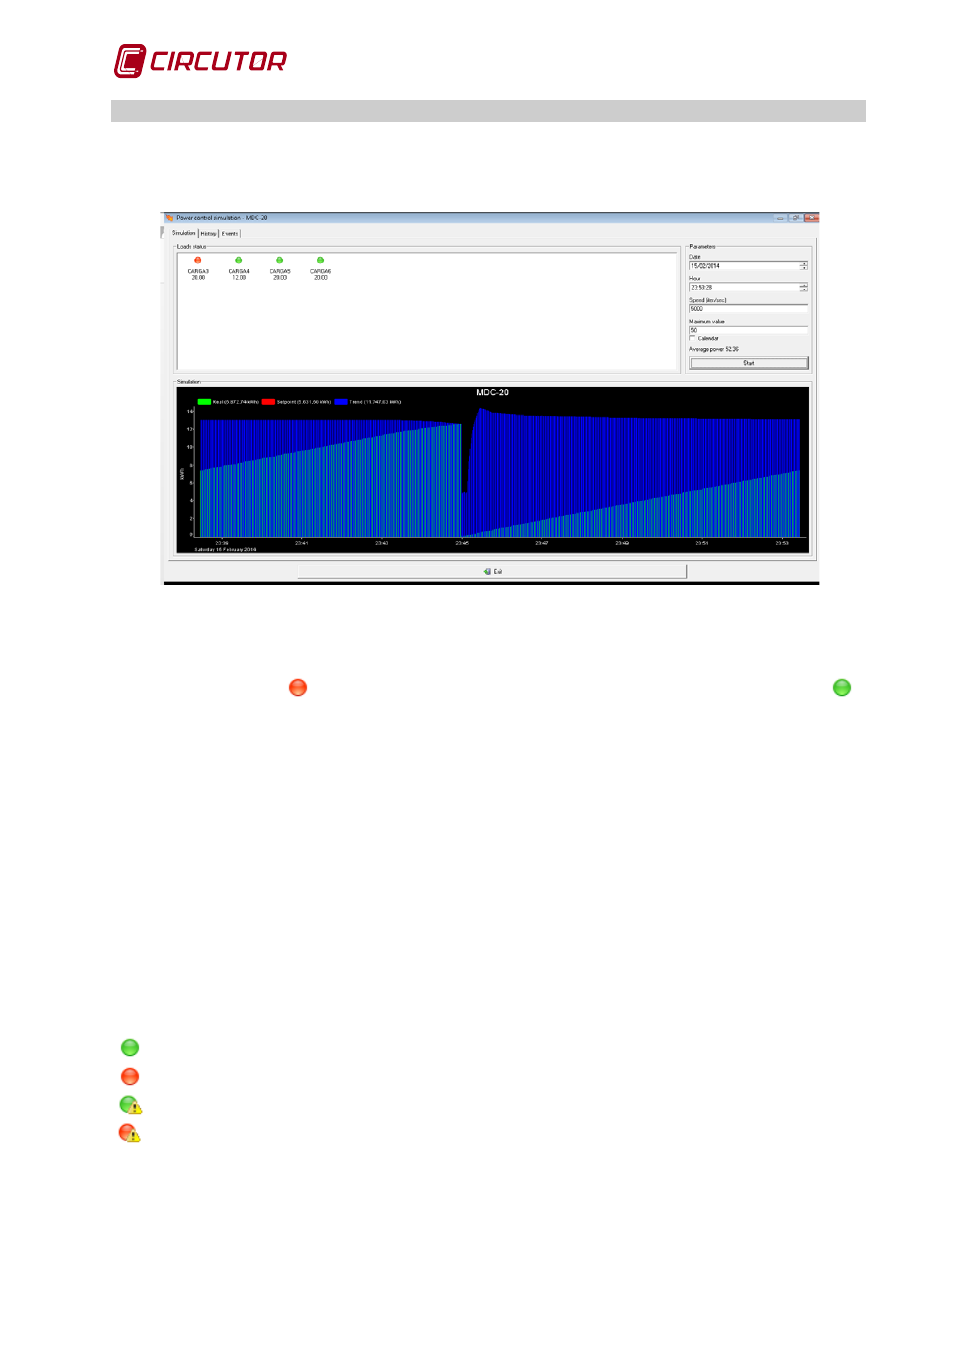
Fig.8-36 . – Graphic obtained by simulation
The graphic part shows all the configured loads. The load status is indicated by a light indicator.
If the indicator is red
it indicates that the load is disconnected. If the indicator is green
it
indicates that the load is connected.
• Date and Time: The date and time of the simulation will appear in real time. You can
modify and enter another date and time.
• Speed (iter/sec): Number of iterations per second. A value of 60 means that for every
real second the program will advance 60 simulated seconds.
• Maximum value: When pressing the right-hand button, the set point value will be that
on the general calendar. If it is not pressed, a set point value can be entered manually.
• Calendar: Indicates whether hourly discrimination per calendar needs to be used in the
simulation and selects the calendar that has been configured in section 8.1.9.
• Average power: It is the average power value of the installation.
• Start: Starts or stops the simulation of the installation.
In the list where the loads configured in the system are displayed, if you right-click the mouse a
menu will appear where you can select the forced connection, forced disconnection or release
of each of the loads.
The light indications of the loads vary according to their status.
Load connected. Automatic management determined by programming.
Load disconnected. Automatic management determined by programming.
Forced load connection. This load cannot be disconnected until it is released.
Forced load disconnection. This load cannot be connected until it is released.
8.2.2 Simulation log
The simulation menu log tab shows a graphic with the simulated data log.