I confidence interval, I distribution (continuous) – Casio FX-9750GII User Manual
Page 194
6-54
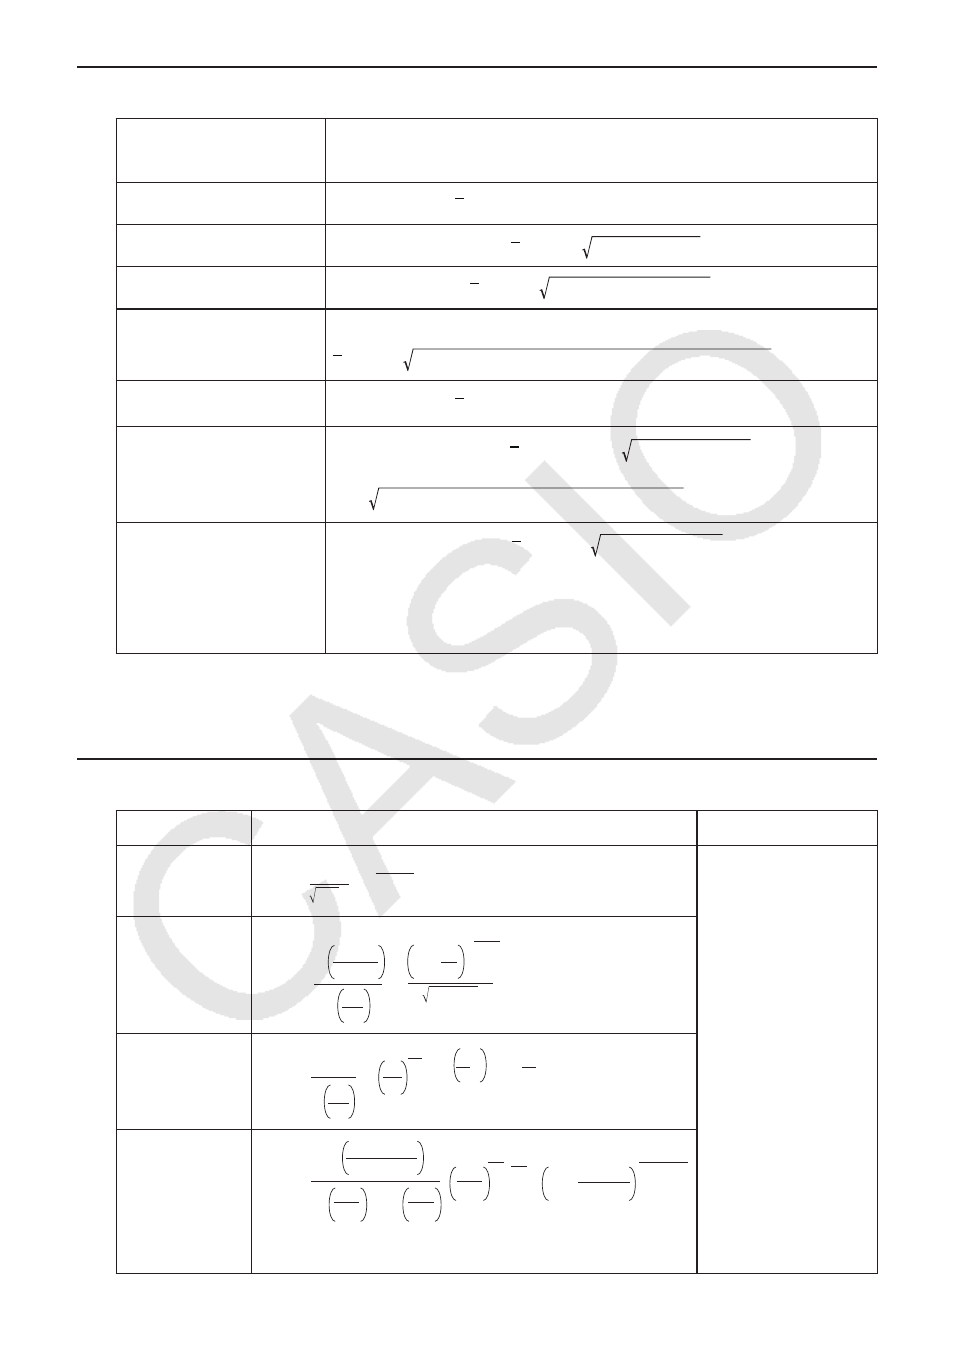
I Confidence Interval
Confidence Interval
Left: confidence interval lower limit (left edge)
Right: confidence interval upper limit (right edge)
1-Sample
Z
Interval
=
o
+
( /2) ·
/
'
α
2-Sample
Z
Interval
= (
o
1
–
o
2
) +
( /2)
/
1
+
/
2
2
1
2
2
α
1-Prop
Z
Interval
Left, Right
=
x
/
n
+
Z
( /2) 1/
n
· (
x
/
n
· (1 –
x
/
n
))
α
2-Prop
Z
Interval
Left, Right
= (
x
1
/
n
1
–
x
2
/
n
2
)
+
Z
( /2) (
x
1
/
n
1
· (1 –
x
1
/
n
1
))/
n
1
+ (
x
2
/
n
2
· (1 –
x
2
/
n
2
))/
n
2
α
1-Sample
t
Interval
Left, Right
=
o
+
t
n
−1
( /2) · s
x
/
'
n
α
2-Sample
t
Interval
(pooled)
Left, Right
= (
o
1
–
o
2
) +
t
n
1
+
n
2
−2
( /2) s
p
2
(1/
n
1
+ 1/
n
2
)
s
p
= ((
n
1
– 1)s
x
1
2
+ (
n
2
– 1)s
x
2
2
)/(
n
1
+
n
2
– 2)
α
2-Sample
t
Interval
(not pooled)
Left, Right
= (
o
1
–
o
2
) +
t
df
( /2) s
x
1
2
/
n
1
+ s
x
2
2
/
n
2
df
= 1/(C
2
/(
n
1
– 1) + (1 – C)
2
/(
n
2
– 1))
α
C
= (s
x
1
2
/
n
1
)/(s
x
1
2
/
n
1
+ s
x
2
2
/
n
2
)
A: level of significance A = 1 − [C-Level ] C-Level : confidence level (0
Z
(
A/2): upper A/2 point of standard normal distribution
t
df
(
A/2): upper A/2 point of
t
distribution with
df
degrees of freedom
I Distribution (Continuous)
Distribution
Probability Density
Cumulative Distribution
Normal
Distribution
2
p
(x) =
1
e
–
2
2
(x –
)
2
(
> 0)
p
=
p
(
x
)
dx
Upper
Lower
Student-
t
Distribution
p
(x) =
df
–
df
+
1
2
2
df
2
df
+ 1
df
x
2
1 +
C
2
Distribution
p
(x) =
(x
0)
1
2
df
df
2
x
2
1
df
2
–1
x
2
–
e
F
Distribution
ndf
2
x
ddf
ndf
ndf
2
–1
ddf
ndf
x
1 +
ndf + ddf
2
p
(x) =
–
2
ndf + ddf
2
ndf
2
ddf
(x
0)