I graph to table, I coordinate rounding, I calculating the root – Casio FX-9750GII User Manual
Page 136
5-30
1. From the Main Menu, enter the GRAPH mode.
2. On the Setup screen, specify On for Derivative.
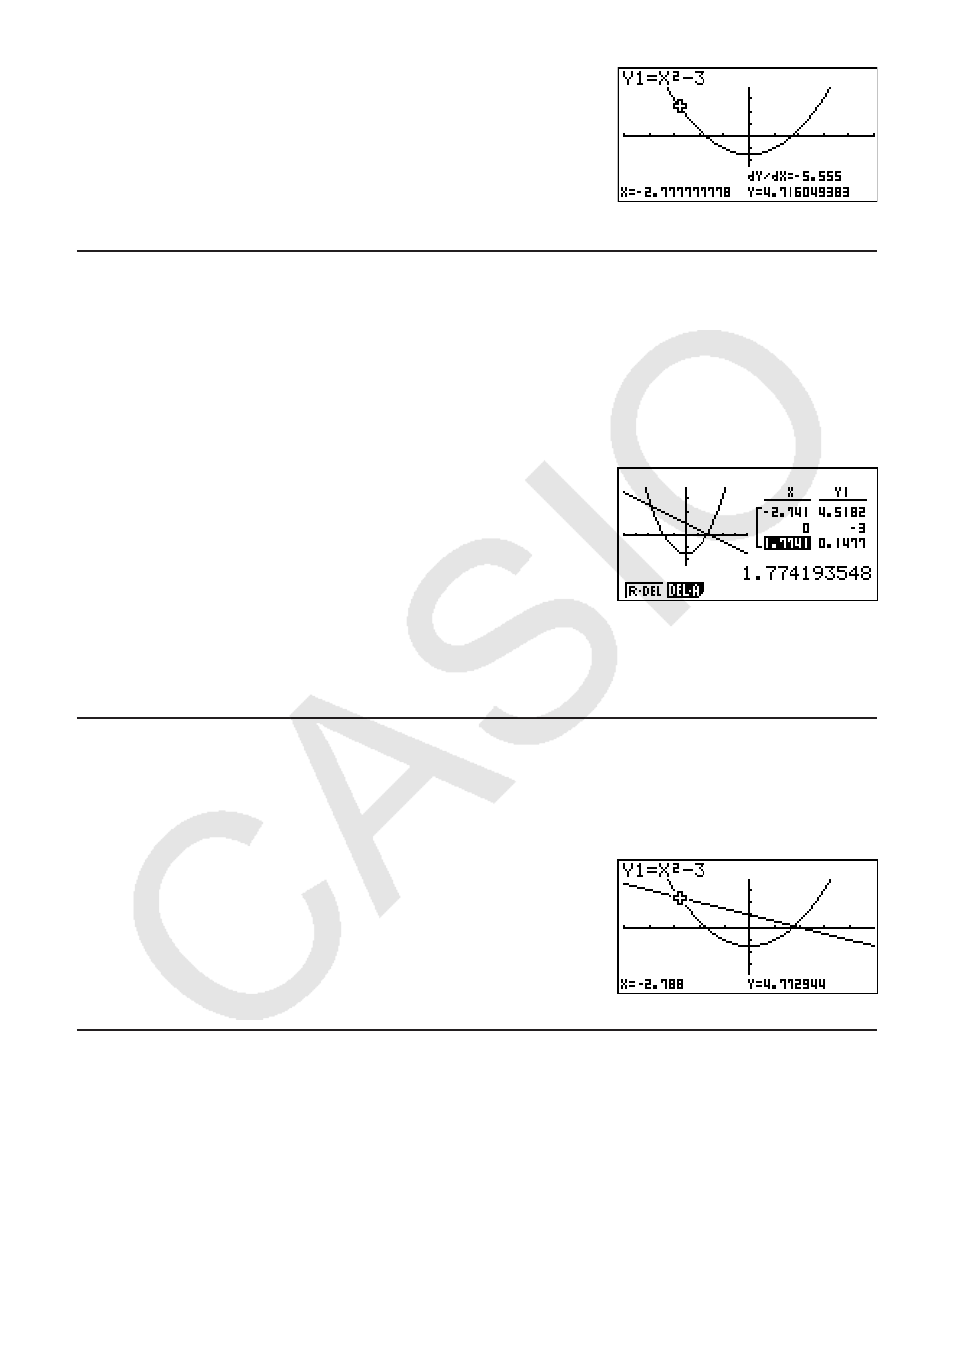
3. Draw the graph.
4. Press
center of the graph. The current coordinates and the
derivative also appear on the display at this time.
I Graph to Table
You can use trace to read the coordinates of a graph and store them in a number table. You
can also use Dual Graph to simultaneously store the graph and number table, making this an
important graph analysis tool.
1. From the Main Menu, enter the GRAPH mode.
2. On the Setup screen, specify GtoT for Dual Screen.
3. Make V-Window settings.
4. Save the function and draw the graph on the
main (left) screen.
5. Activate Trace. When there are multiple graphs on
the display, press
D and A to select the graph you
want.
6. Use
B and C to move the pointer and press U
to store coordinates into the number table. Repeat
this step to store as many values as you want.
7. Press
*(CHNG) to make the number table active.
I Coordinate Rounding
This function rounds off coordinate values displayed by Trace.
1. From the Main Menu, enter the GRAPH mode.
2. Draw the graph.
3. Press
the V-Window settings to be changed automatically
in accordance with the Rnd value.
4. Press
to move the pointer along the graph. The coordinates
that now appear are rounded.
I Calculating the Root
This feature provides a number of different methods for analyzing graphs.
1. From the Main Menu, enter the GRAPH mode.
2. Draw the graphs.
3. Select the analysis function.
(MAX) ... Local maximum value
(MIN) ... Local minimum value