Function analysis, Function analysis -29, I reading coordinates on a graph line – Casio FX-9750GII User Manual
Page 135: I displaying the derivative
5-29
(TYPE)(Y=)TTAT_
AU
(DRAW)
C~CU*
1
*
1
You can draw a tangent line in succession by moving the “
” pointer and pressing
U.
12. Function Analysis
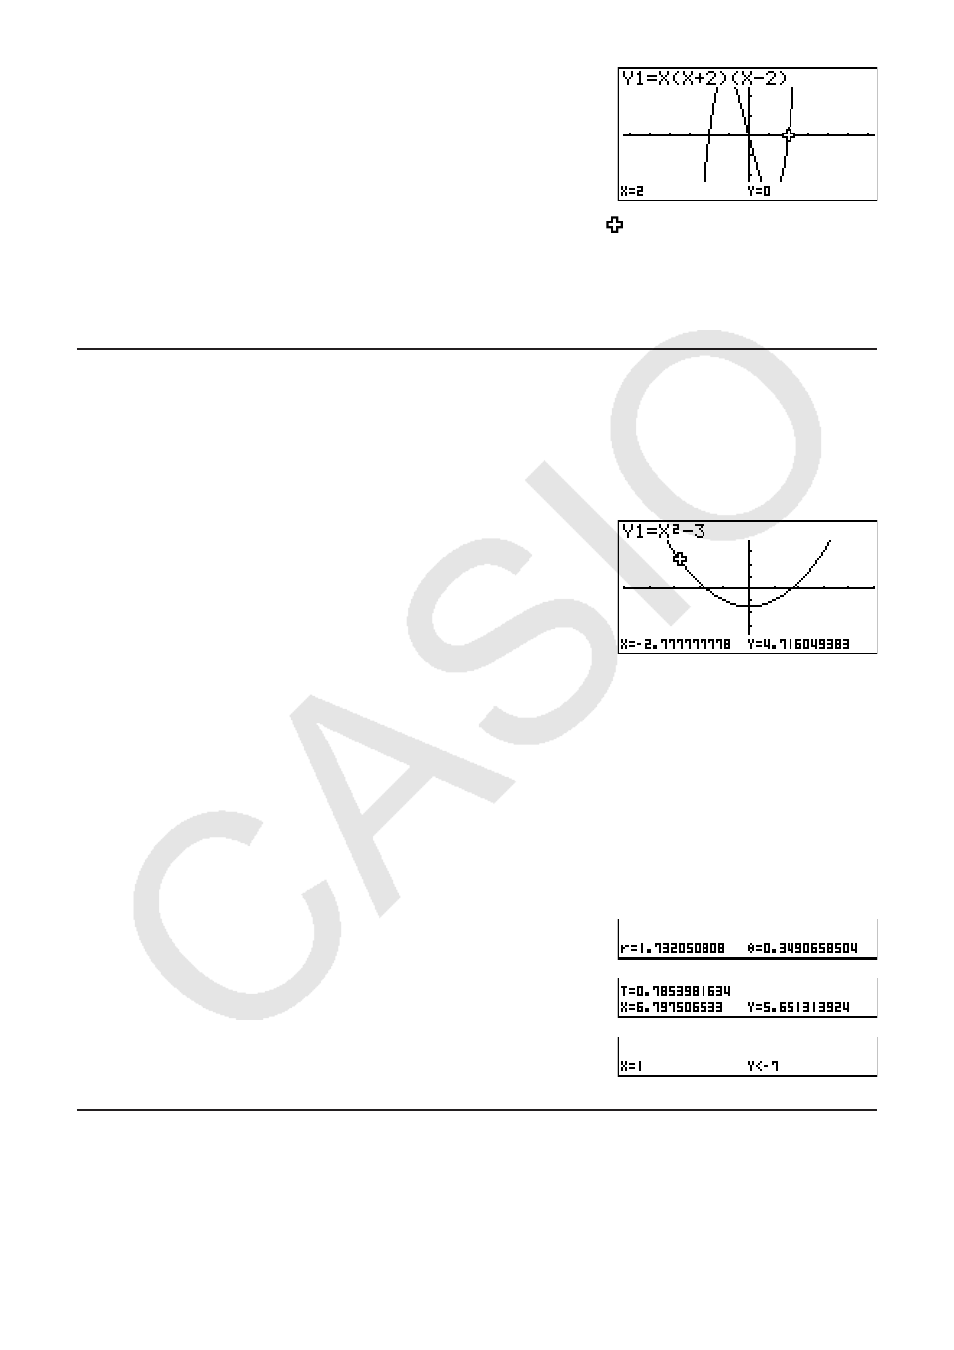
I Reading Coordinates on a Graph Line
Trace lets you move a pointer along a graph and read out coordinates on the display.
1. From the Main Menu, enter the GRAPH mode.
2. Draw the graph.
3. Press
1
4. Use
B and C to move the pointer along the graph to
the point at which you want to display the derivative.
When there are multiple graphs on the display, press
\
D and A to move between them along the
x
-axis of
the current pointer location.
5. You can also move the pointer by pressing
T to display the pop-up window, and then
inputting coordinates.
The pop-up window appears even when you input coordinates directly.
To exit a trace operation, press
*
1
The pointer is not visible on the graph when it is located at a point outside the graph display
area or when an error of no value occurs.
• You can turn off display of the coordinates at the pointer location by specifying “Off” for the
“Coord” item on the Setup screen.
• The following shows how coordinates are displayed for each function type.
Polar Coordinate Graph
Parametric Graph
Inequality Graph
I Displaying the Derivative
In addition to using Trace to display coordinates, you can also display the derivative at the
current pointer location.