I selecting the regression type, I displaying regression calculation results – Casio FX-9750GII User Manual
Page 150
6-10
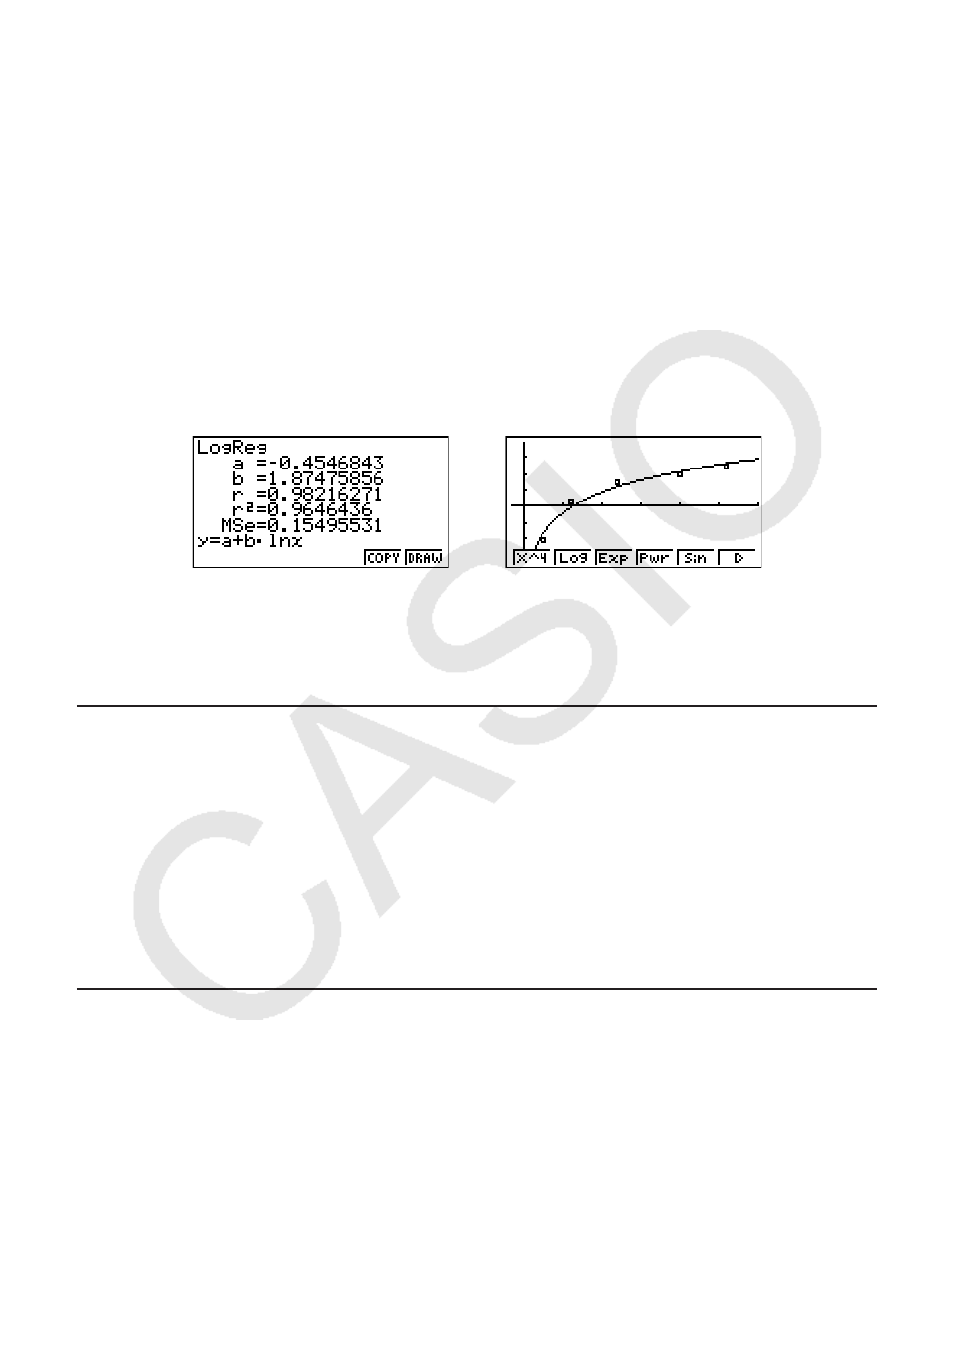
Example Input the two sets of data shown below and plot the data on a scatter
diagram. Next, perform logarithmic regression on the data to display the
regression parameters, and then draw the corresponding regression
graph.
0.5, 1.2, 2.4, 4.0, 5.2 (
x
List)
–2.1, 0.3, 1.5, 2.0, 2.4 (
y
List)
K STAT
? DU@ AUA CUCUD AUC
A @U? BU@ DUAUA CU
(GRPH)(SET)A(Scat))(GPH1)
(CALC)(E)(Log)
(DRAW)
• You can perform trace on a regression graph. You cannot perform trace scroll.
• Input a positive integer for frequency data. Other types of values (decimals, etc.) cause an
error.
I Selecting the Regression Type
After you graph paired-variable statistical data, you can use the function menu at the bottom of
the display to select from a variety of different types of regression.
• {
ax
+
b
}/{
a
+
bx
}/{Med}/{X^2}/{X^3}/{X^4}/{Log}/{
ae
^
bx
}/{
ab
^
x
}/{Pwr}/{Sin}/{Lgst} ...
{linear regression (
ax
+
b
form)}/{linear regression (
a
+
bx
form)}/{Med-Med}/{quadratic
regression}/{cubic regression}/{quartic regression}/{logarithmic regression}/{exponential
regression (
ae
bx
form)}/{exponential regression (
ab
x
form)}/{power regression}/
{sinusoidal regression}/{logistic regression} calculation and graphing
• {2VAR}... {paired-variable statistical results}
I Displaying Regression Calculation Results
Whenever you perform a regression calculation, the regression formula parameter (such as
a
and
b
in the linear regression
y
=
ax
+
b
) calculation results appear on the display. You can use
these to obtain statistical calculation results.
Regression parameters are calculated as soon as you press a function key to select a
regression type, while a graph is on the display.
The following parameters are used by linear regression, logarithmic regression, exponential
regression, and power regression.
r
.............. correlation coefficient
r
2
............. coefficient of determination
MSe
......... mean square error