Vernier Data Pro User Manual
Page 29
Data Pro
27
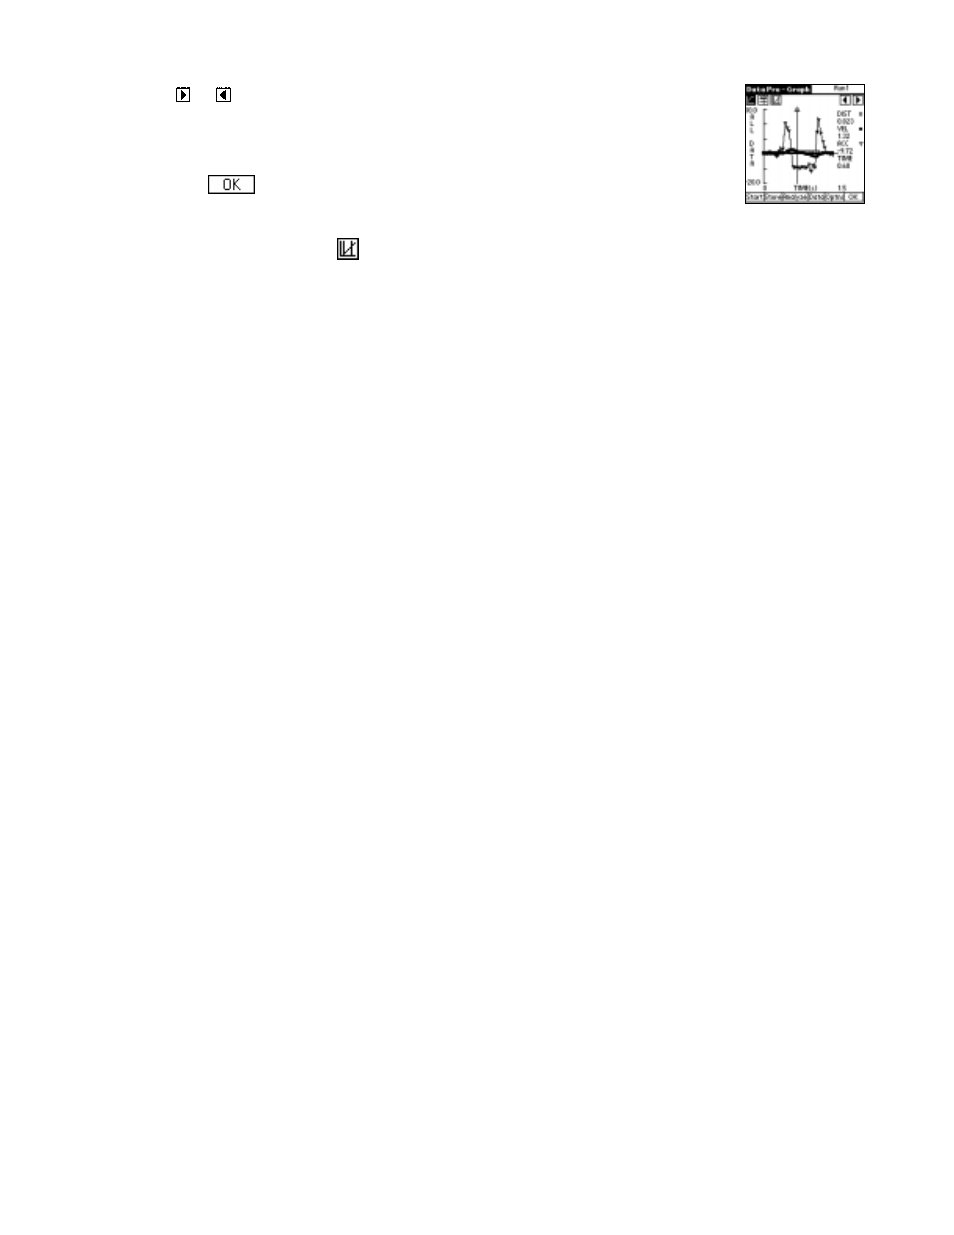
Tap or
to examine the data points along the graph. As you move the
vertical line right or left, the time (X) and temperature (Y) values of each data
point are displayed to the right of the graph.
Tapping
in the graph screen will take you back to the main screen.
Select Region by tapping
in the graph screen to zoom in on a region of interest. This option
may be necessary for curve fitting. Data outside the selected region are not deleted; the
horizontal range of the graph is temporarily changed and only the selected region is used for
curve fitting and statistical analysis.