Vernier Data Pro User Manual
Page 24
Data Pro
22
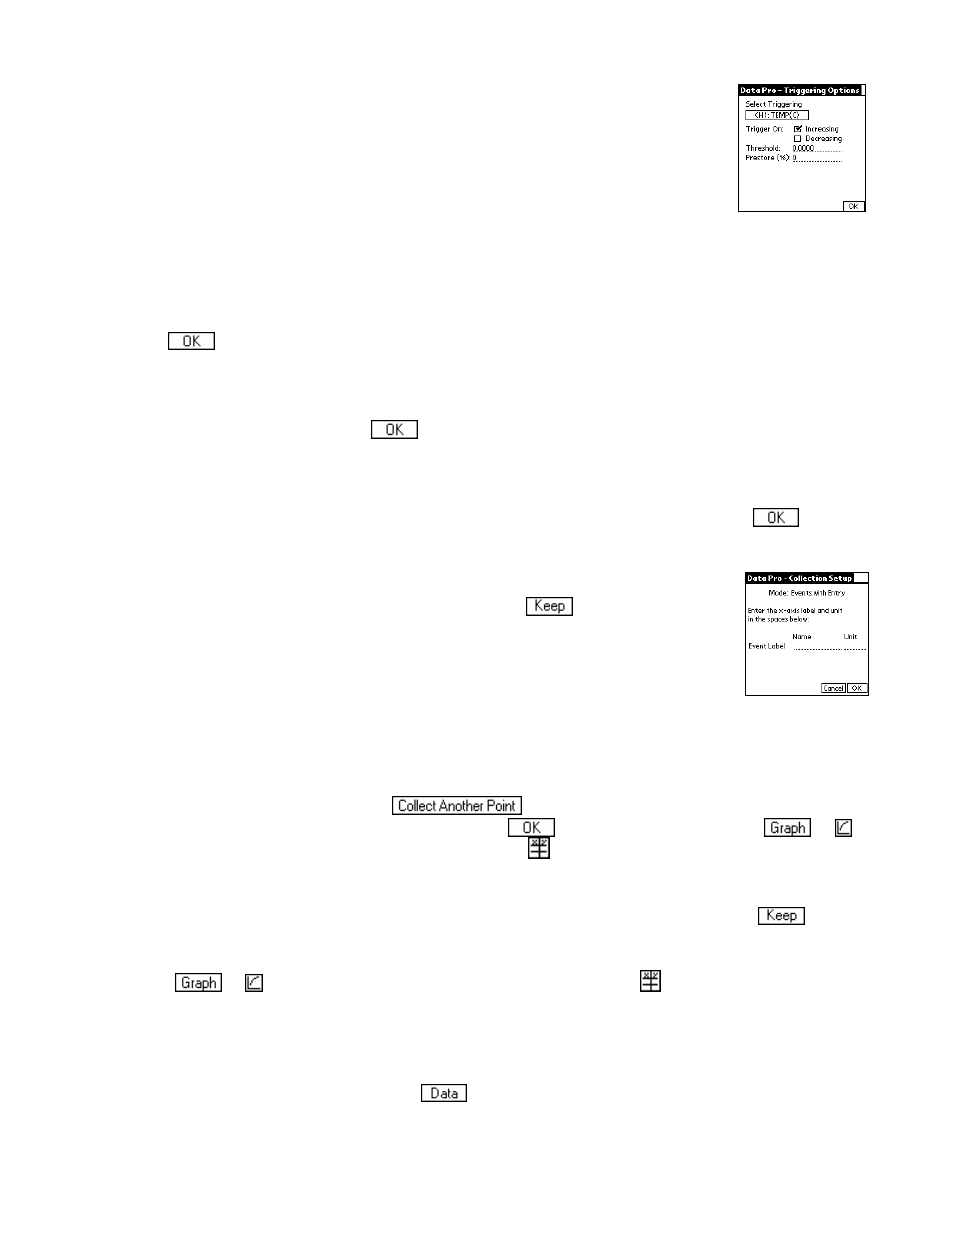
If you choose to trigger on a channel, Data Pro asks you to choose the trigger
type.
•
INCREASING
means that data collection will not start until the sensor
readings (such as light intensity or temperature) increase through the
selected threshold.
•
DECREASING
means that data collection will not start until sensor
readings decrease through the selected threshold.
Enter the number in sensor units (the threshold) at which you want data collection to begin and
tap
. When the values of the data being collected reach this threshold value, LabPro will
begin storing data.
Write in the number (in percent of the total number of points to be collected) of data you want
the LabPro to prestore and tap
. Prestore is the amount of data collected before the
threshold was reached that you want to keep (10 percent, 20 percent, and so on). From the time
the experiment begins until the threshold is reached, LabPro collects data in a buffer. When the
threshold is reached, LabPro begins storing the data it is collecting and discards the data it
collected before the threshold was reached unless a prestore value is entered. Tap
twice
more to return to the main screen.
Events with Entry mode is used for titrations, Boyle’s law, and so forth. Data
are collected one point at a time and only when the
button on the Palm is
pressed. You are then prompted to enter the corresponding value.
After selecting this mode, Data Pro asks you to enter the label name and unit.
Single Point data collection is used to collect one averaged data point. This mode is very
popular when collecting water quality data. The interface will collect data for 10 seconds and
report a single, averaged value for each sensor on the Palm screen. This value is stored in the
Data Table. You can now tap the
button, and collect another single point
reading. Do this as many times as you want. Tap
to quit collecting data. Tap
or
to view a graph of single points vs. sample (n). Tap
to view the data points in the data table.
You may add more data points after viewing the graph by tapping the Start button again.
Selected Events
mode collects data from each channel in response to pressing the
button,
but the user does not enter any values; rather, a sample number (e.g., 1, 2, 3…) is assigned to
each data point. When data collection is completed, a graph of data vs. sample (n) is plotted.
Tap
or
to view a graph of data points vs. sample (n). Tap
to view the data points in
the data table.
Selecting Manual Entry
creates a new data pair
in which you can manually enter data. Initially,
a screen will be called up prompting you to enter both the x- and y-axis labels and units. This
data can later be accessed by tapping
in the Graph screen. Note: You can try out this mode
by doing Tutorial 5: Data Pro as a Stand-Alone Graphing Program.