Vernier Data Pro User Manual
Page 16
14
Data Pro
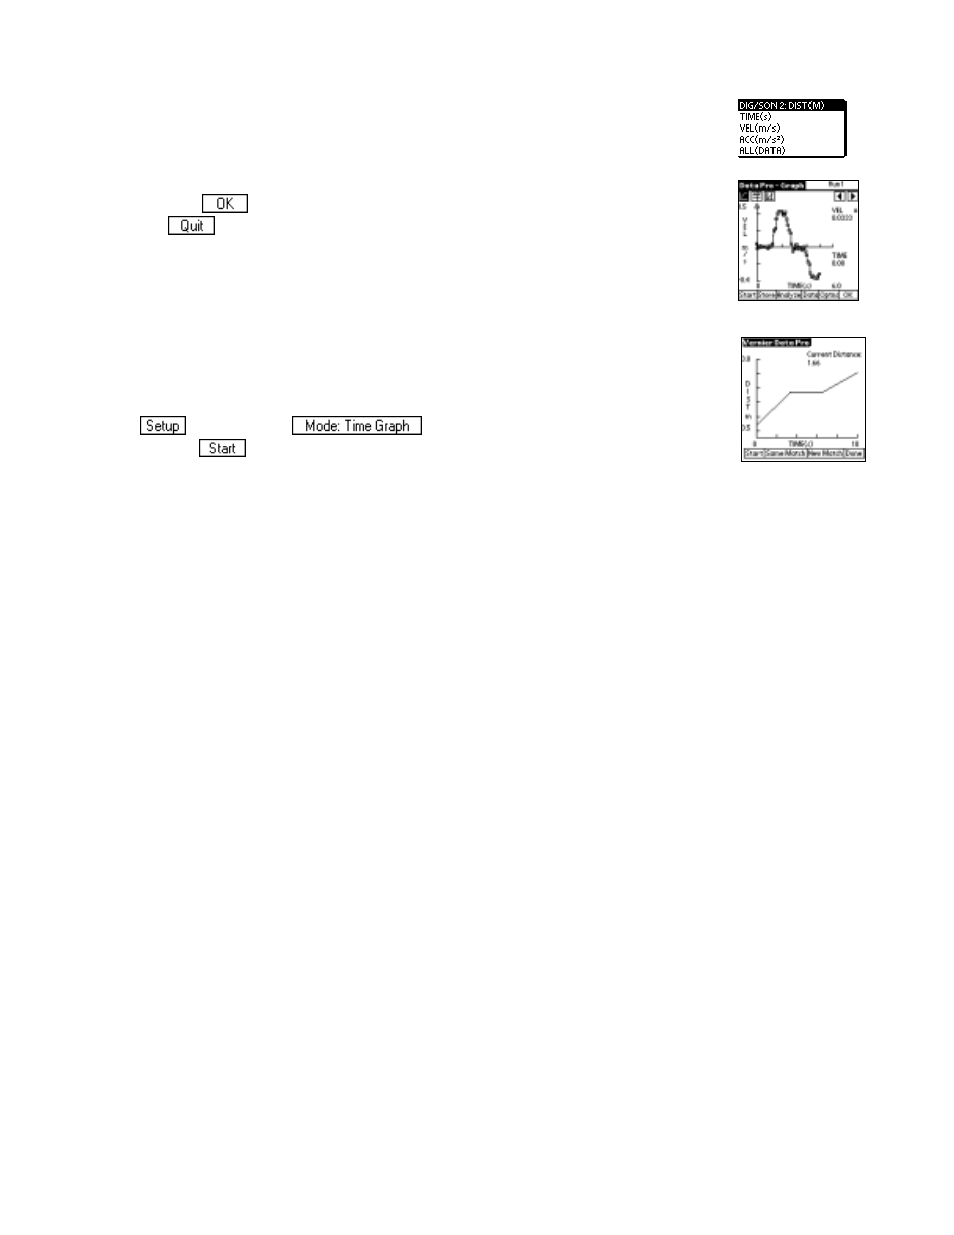
7. Tap the y-axis, and then tap on the velocity column to view a graph of
velocity vs. time.
You will be presented with a velocity vs. time graph.
8. Tap
to return to the Main screen, to do another tutorial, or tap
to exit Data Pro program.
Note: As an Extension of this tutorial, you may want to try selecting a special
mode in Data Pro, Graph Matching. This mode has students match a graph
(like the one shown here) with distance or velocity data collected like you did
in this tutorial. You can select this mode on the Main screen by first tapping
, then tapping
and choosing Graph Matching. When
you tap
in this mode, a distance vs. time graph like the one shown here
will be displayed, and you can try matching it.