4 more about calibration, 1 adjusting final calibration, 2 zero deadload a/d counts – Rice Lake 420 Plus HMI Digital Weight Indicator Installation Manual User Manual
Page 36: Adjusting final calibration, Zero deadload a/d counts
32
420 Plus Installation Manual
6. When span calibration is complete, a dialog box
asks whether you wish to perform linear
calibration. Click
Ye s
to perform linear
calibration for up to five linearization points, or
click
No
to complete calibration (see step 8).
7. On the Linear Calibration display, select the
point (1–5) to calibrate, then click
Calibrate
.
Place test weights on scale then click
OK
.
When prompted, enter the test weight value
then press Enter. Repeat for additional
linearization points, then click
Exit
to return to
the Indicator Calibration display.
8. When calibration is complete, the
New Settings
fields of the Indicator Calibration display are
filled in. Click
Exit
to save the new values and
return to the
Revolution
main menu; to restore
the previous calibration values, click
Restore
Settings
.
4.4
More About Calibration
The following topics provide additional information
about compensating for environmental factors
(Section 4.4.1) and diagnostic information for
determining expected zero and span coefficients.
4.4.1
Adjusting Final Calibration
Calibration may be affected by environmental factors
including wind, vibration, and angular loading. For
example, if the scale is calibrated with 1000 lb, a strain
test may determine that at 2000 lb the calibration is 3 lb
high. In this case, final calibration can be adjusted by
tweaking WVAL to 998.5 lb. This adjustment provides
a linear correction of 1.5 lb per 1000 lb.
To adjust the final calibration, return to the
WVAL
prompt and press to show the test weight value.
Press or to adjust calibration up or down. Press
to save the value, then press to return to the CALIBR
menu.
4.4.2
Zero Deadload A/D Counts
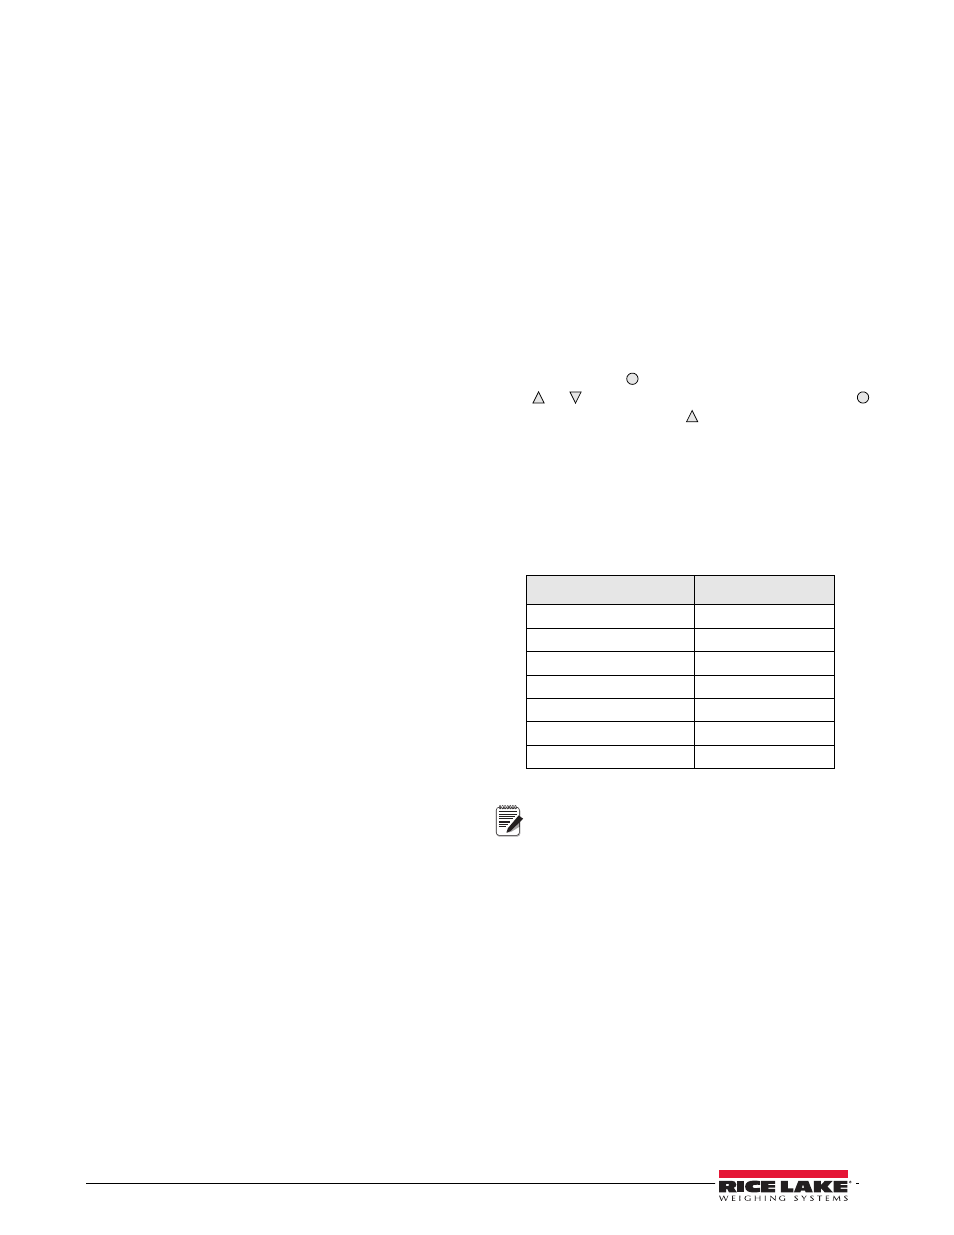
Table 4-1 lists the ideal A/D counts that result from
input signals of 0–3.0 mV with zero deadload. Actual
values will typically be higher than the values shown in
Table 4-1 but the ideal values can be used when
calibrating the indicator with no attached scale.
Table 4-1. Ideal A/D Raw Counts
Input Signal (mV)
Raw A/D Counts
0.0 mV/V
167,840
0.5 mV/V
335,613
1.0 mV/V
503,377
1.5 mV/V
671,143
2.0 mV/V
838,908
2.5 mV/V
1,100,668
3.0 mV/V
1,174,446
Note
When Raw A/D Count is displayed, the six most
significant digits appear. Scroll left or right to
see the full value.