EdgeWare FastGraph Version 3 User Manual
Page 50
50
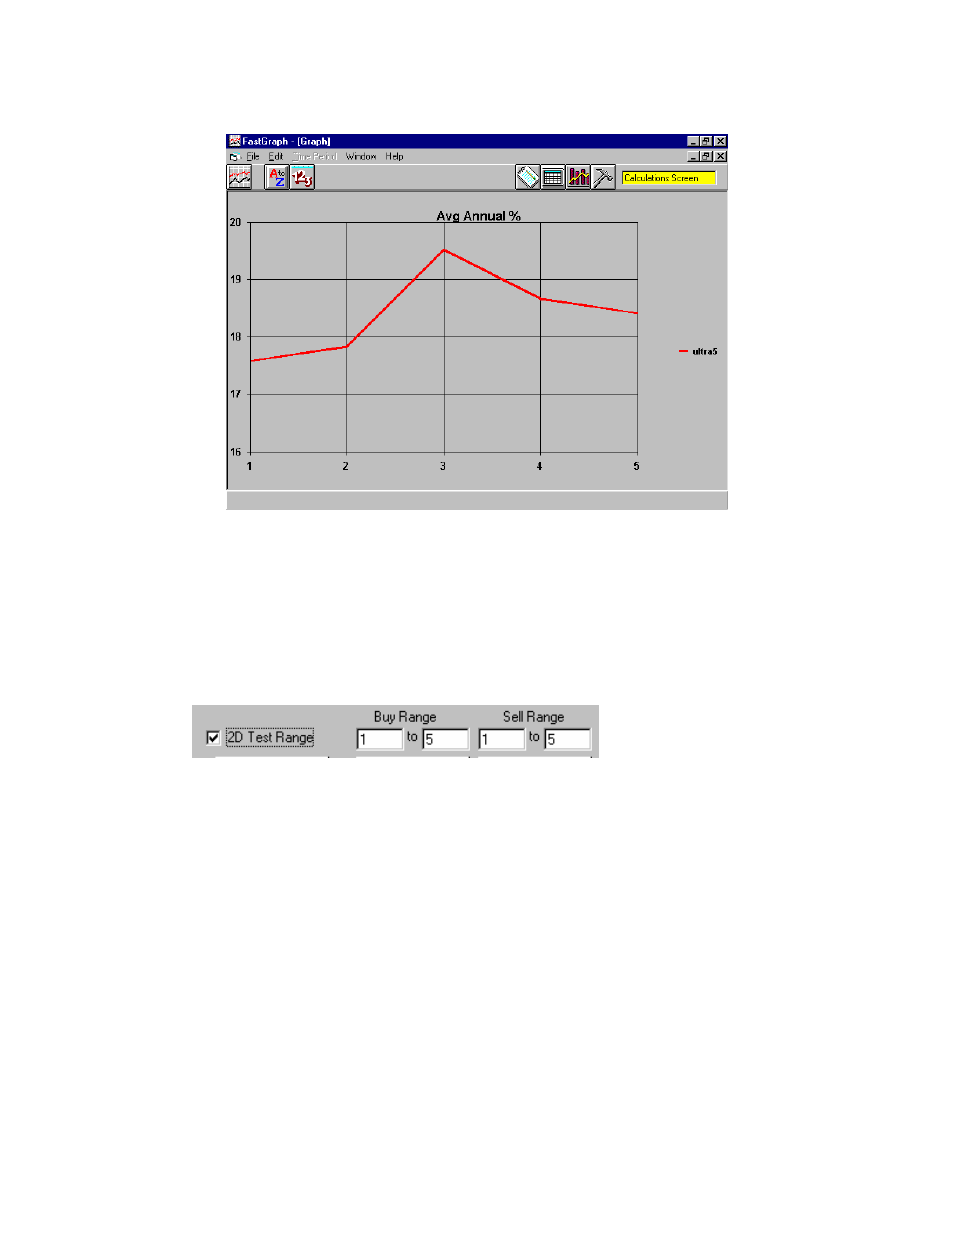
From this graph we see that we get the best annual return when we “Buy” with any three
of the four signals in the market. We would sell if there are less than three separate sig-
nals on a buy.
You can also examine MDD, UI, UPI and switches per year in the same manner if you
select a different Y Parameter.
To make a Two Dimensional analysis (2D) go back to the Calculations Screen. Now,
select:
Notice that we now have separate fields for Buy Range and Sell Range. FastGraph can
now use or have a different number of “buy” signals to go long the market than the num-
ber of “buy” signals to leave the market. For example, a strategy may enter the market
when four of five separate signals are on a buy but not sell until there are only two sig-
nals still on a buy. Note: FastGraph always looks at the direction of the last change in
signals. This will be explained in the following example.
Create a Sig Summary File by clicking the Calc Sig Sum button. When the calculation is
complete go the Main Screen and load the file. Since we have made a 2D run we can use
Contour as the Graph Type. Here are the results: