EdgeWare FastGraph Version 3 User Manual
Page 35
35
FastTrack Example #7 - Correlation Analysis
Correlation Analysis allows the comparison of funds and indexes to determine how
closely related they may be. FastGraph uses the common Pearson’s correlation to do this
analysis. Maximum correlation has a value of 1.0 and negative correlation has a value of
-1.0
If an investor is trying to be diversified by holding more than one fund it may be a good
idea to hold two funds that have a low correlation. Correlation can also be used for inter-
market analysis.
To display the correlation between two funds, first load a FastTrack family or individual
funds. Next, go to the Data screen and highlight the two funds you want to analyze (only
two funds at a time), go to the main FastGraph screen and select Show Correlation and
enter the number of trading days to use in the calculation, a minimum value of 50 trading
days is recommended. Finally, click the graph icon.
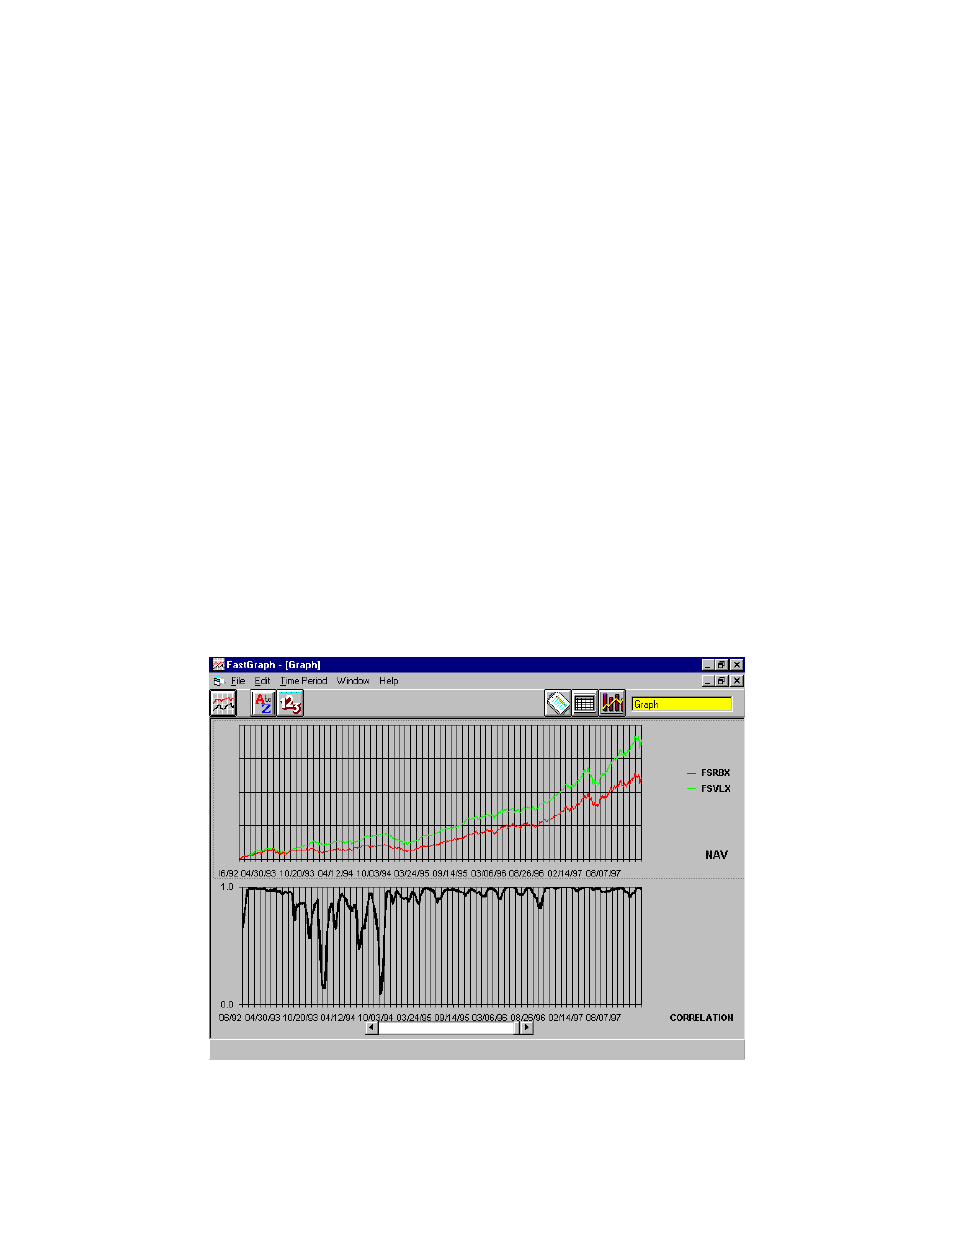
FastGraph shows the NAV of the funds (or indexes) in the upper part of the screen, the
lower part of the screen shows the correlation value.
The following chart shows the correlation is very high between Fidelity Select Regional
Banks and Select Home Finance, as would be expected. However, notice that there are
periods when the correlation does change dramatically. The chart is for a total of five
years.