EdgeWare FastGraph Version 3 User Manual
Page 29
29
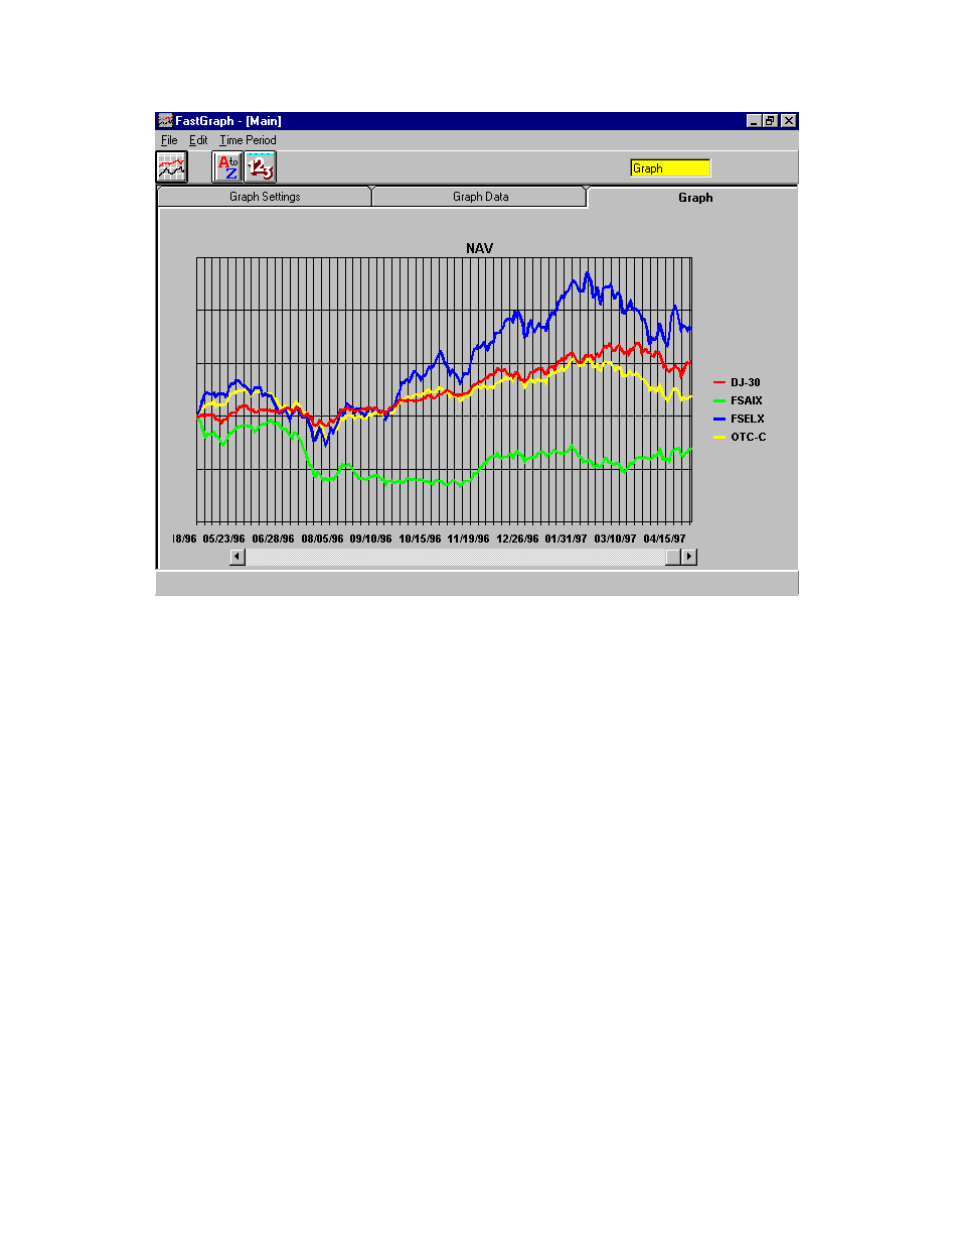
This graph makes it much easier to compare multiple funds and indexes.
FastTrack Example #2 - Exponential Moving Average/Adaptive Moving Average
Exponential moving average (EMA) analysis is one of the most common techniques in
technical analysis. See your FastTrack manual for a description how exponential moving
averages are calculated.
To display a fund with it’s EMA, first load a FastTrack family or individual funds. Next,
go to the Data screen and highlight the fund(s) you want to display, go to the FastGraph
main screen and select Show Exp Moving Avg and enter a period over which to calculate
the EMA. Determine if you want to show all the selected funds at once or one at a time.
Finally, click the graph icon.