EdgeWare FastGraph Version 3 User Manual
Page 24
24
Note: If you have any doubt about the effectiveness of this AccuTrack strategy here are
the buy and hold values for each fund and the S&P 500 index over the same time pe-
riod:
FSENX 156%
FSESX 227%
FSRFX 225%
S&P 500
197%
The AccuTrack system easily beats these values using ANY set of parameters. It is also
clear that trading Transportation with Energy Service is the preferred pair. The next step
is to determine the AccuTrack parameters that give a good robust strategy. Go to the
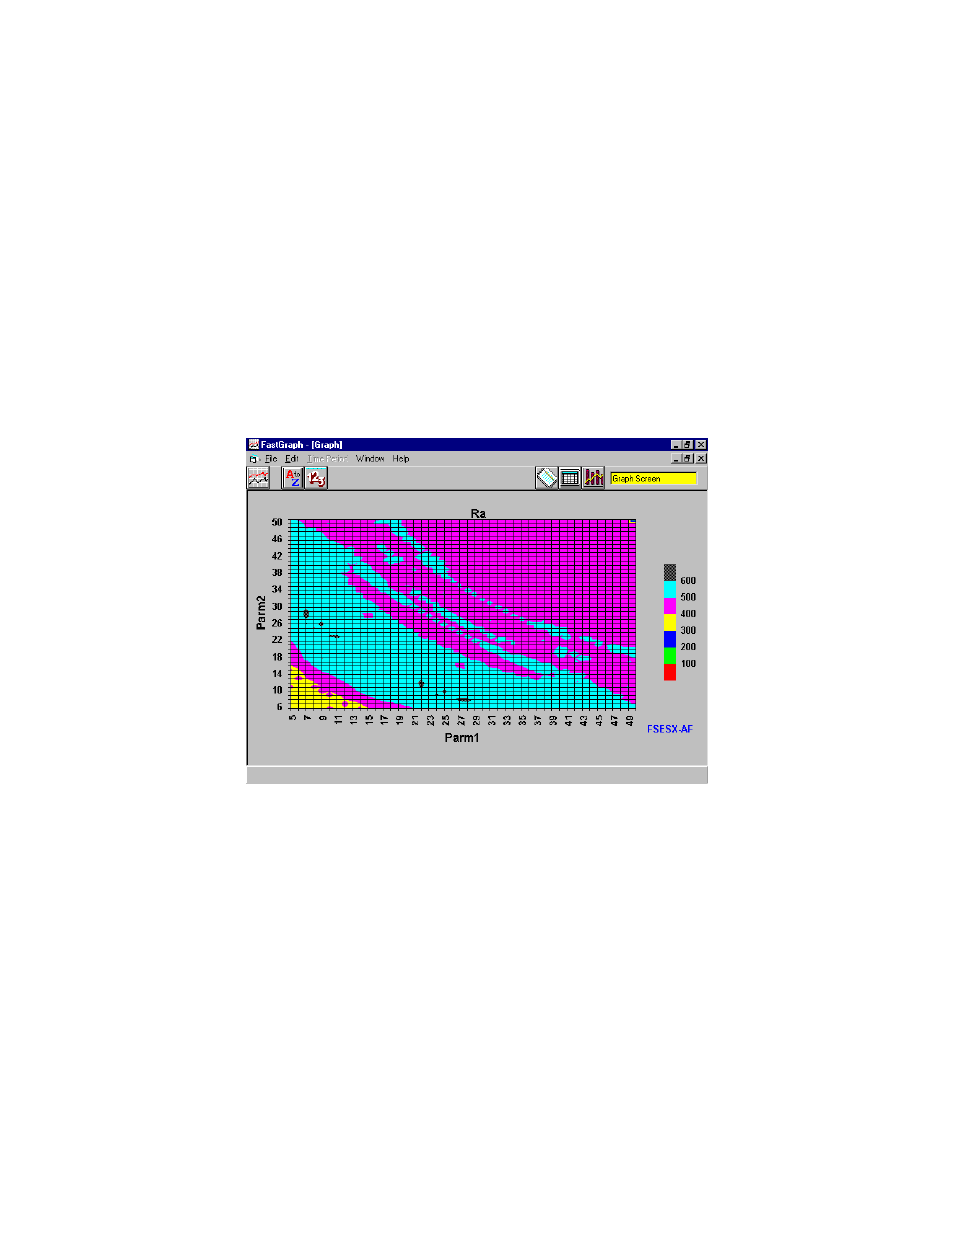
FastGraph Data Tab and bring the FSESX/FSRFX data to the top. Go to the main screen
and select Contour as the graph type and Ra as the Data field. Here is the graph:
The set of parameters that result in the best Ra (600% or greater) form a wide band cen-
tered in the area of 15/22. Other FastWays output parameters such as switches per year
could be used to further refine the parameter choices.
Here are other studies to consider:
Rather than using Select Transportation, perhaps Select Air Transportation would have
been a better choice. Run FastWays switching between Air Transportation and the two
energy funds. Import these two FastWays files into FastGraph, sort the data and compare
all four line graphs.
Some AccuTrack users trade between a mutual fund and a common index, i.e., DJ-30,
S&P 500, OTC, etc. A good question is which index should be used because different
equity funds respond differently to the different market indexes. Make different Fast-