EdgeWare FastGraph Version 3 User Manual
Page 26
26
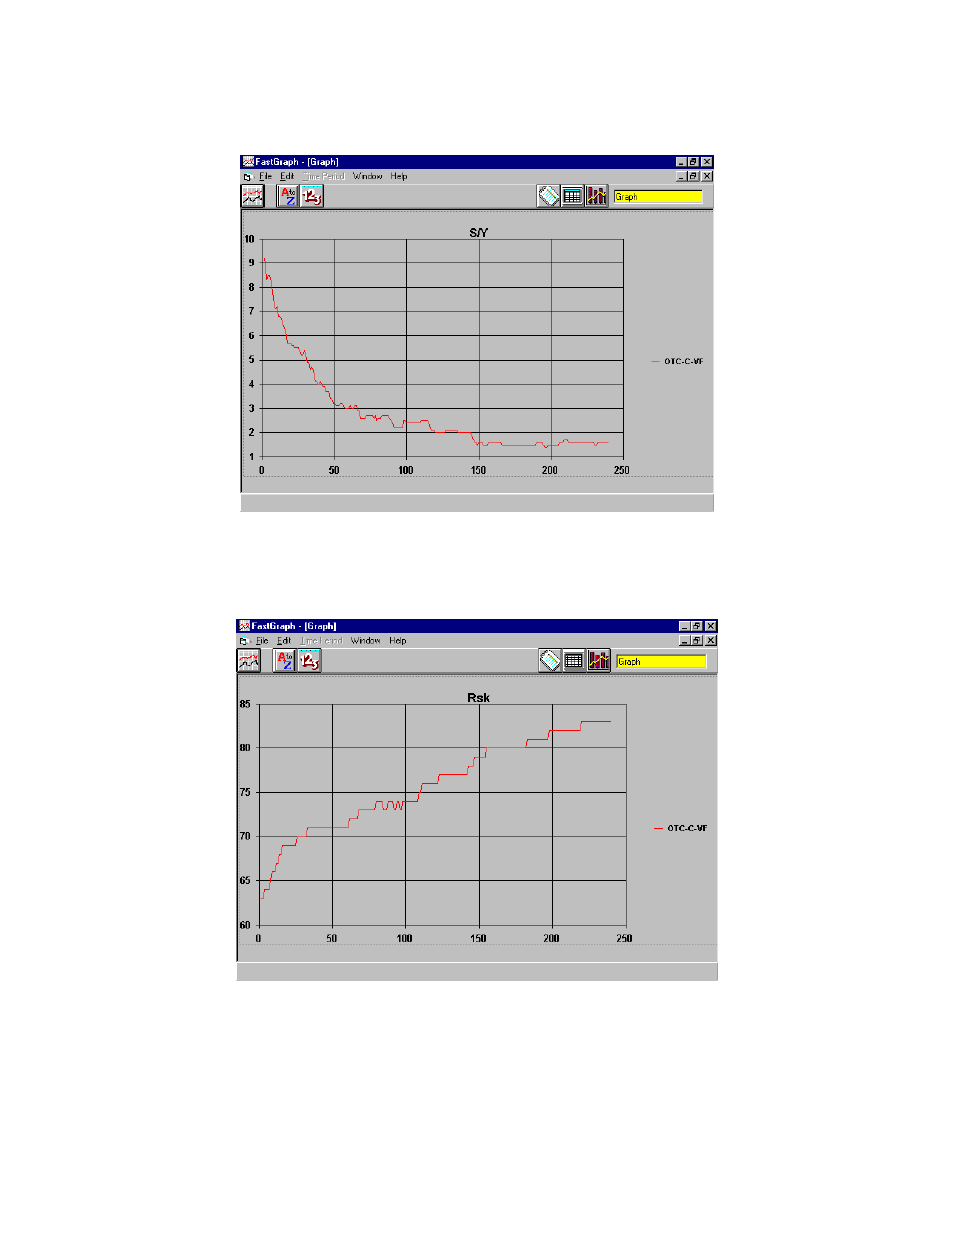
Selecting Switches per Year give the following graph:
The number of switches is a reasonable 2-4 per year for the most favorable Ma.
Finally, charting risk:
The risk (percent time invested in the OTC index) for the most favorable moving average
values is in the range of 70-75%
Maximum Draw Down (MDD) could be examined to determine the benefit of using the
moving average vs. buy and hold.