EdgeWare FastGraph Version 3 User Manual
Page 31
31
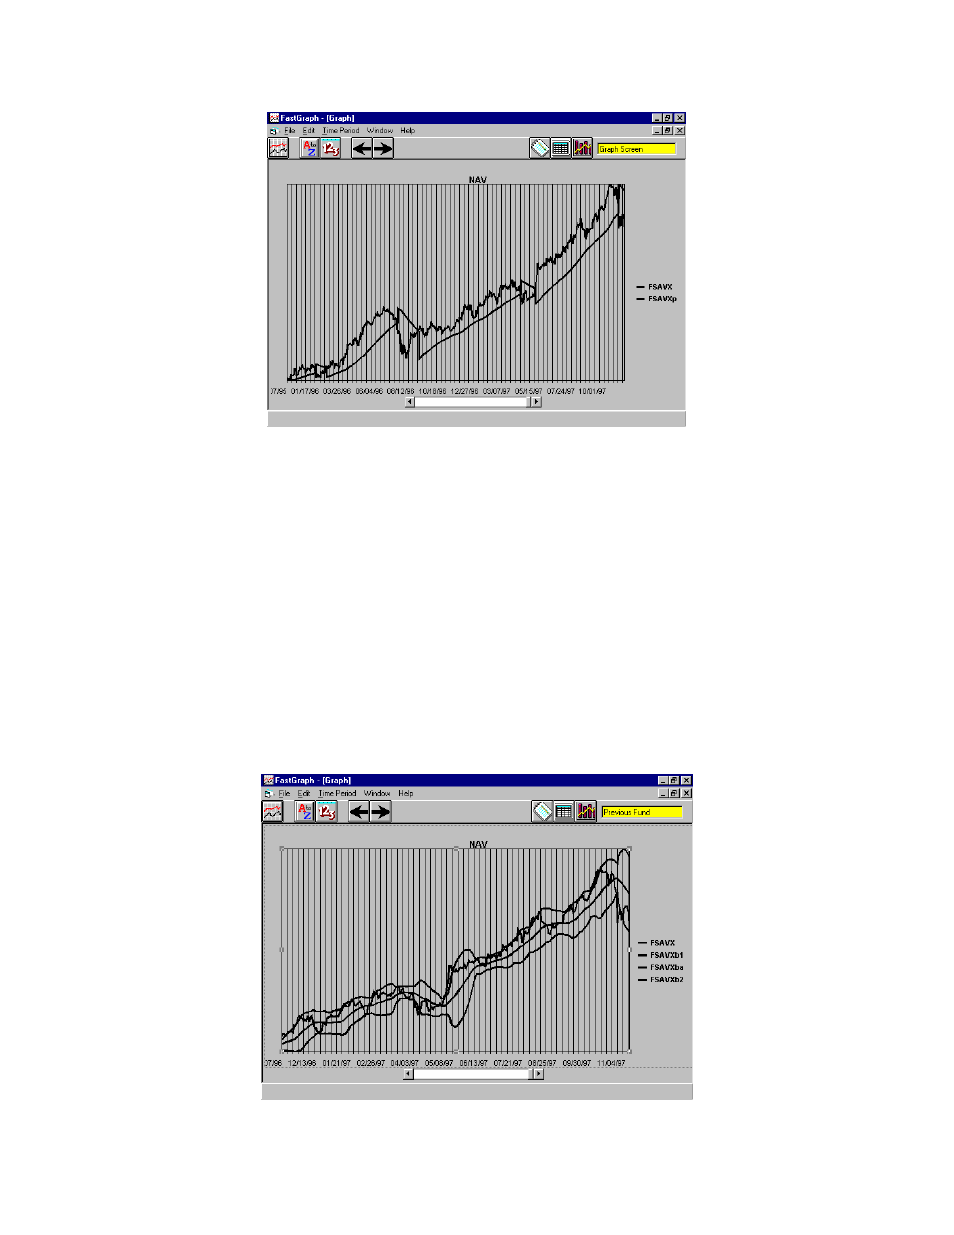
FastTrack Example #4 - Bollinger Bands
Bollinger Bands are used by many technical analysts. See Appendix A for an explana-
tion of how Bollinger Bands are calculated.
To display a fund with its Bollinger Bands, first load a FastTrack family or individual
funds. Next, go to the Data screen and highlight the funds you want to display, go to the
main FastGraph screen and select Show Bollinger Bands and enter the number of trading
days to use in the calculation - the typical value is 20 days. Determine if you want to
show all the selected funds at once or one at a time. Finally, click the graph icon.
FastGraph shows the NAV of the fund, the upper and lower Bollinger Band, and the
moving average for the period used in the Bollinger Band calculation. The Bands are +/-
2 standard deviations from the average.