EdgeWare FastGraph Version 3 User Manual
Page 27
27
FastWays Example #3 - MACD
Since the functions that FastWays evaluates have different number of parameters Fast-
Graph changes the graph selection parameters depending on the type of file imported.
For example, AccuTrack has two parameters but MACD has three. There is also the is-
sue of how to determine parameters if the function has more than two independent vari-
ables. MACD is an example since it has three parameters. Here is a method to help de-
termine good parameter ranges.
First, make a FastWays run on a fund over a wide range of MACD parameters. Import
this file into FastGraph. What we want to see are those parameters that give the best Mr
return. Sort the FastWays file by Mr in descending order. Next, set 10% as the % of data
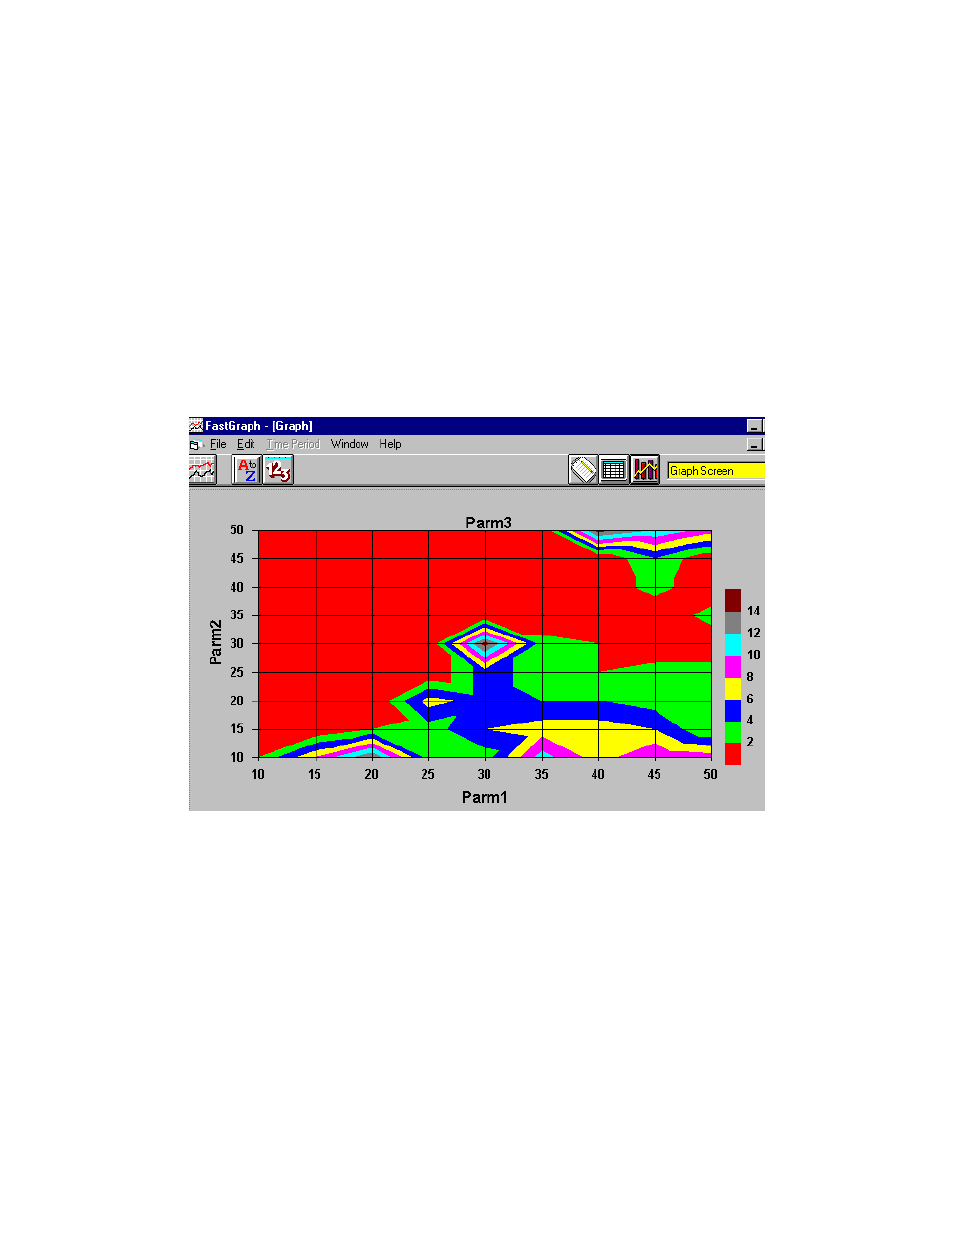
to graph. Now graph the data:
In this case the MACD parameter 1 and 2 were varied from 10 to 50. Parameter 3 was
varied from 2 through 15. This graph only shows the results of the “best” 10% of the test
cases. The results indicate that good Parm1 values are in the 25-50 range, Parm 2 is in
the 10-30 range, and finally, the best Parm 3 values are in the 2-4 range.
Again, the values can be further refined by looking at switches per year, Mr, Risk etc.