EdgeWare FastGraph Version 3 User Manual
Page 30
30
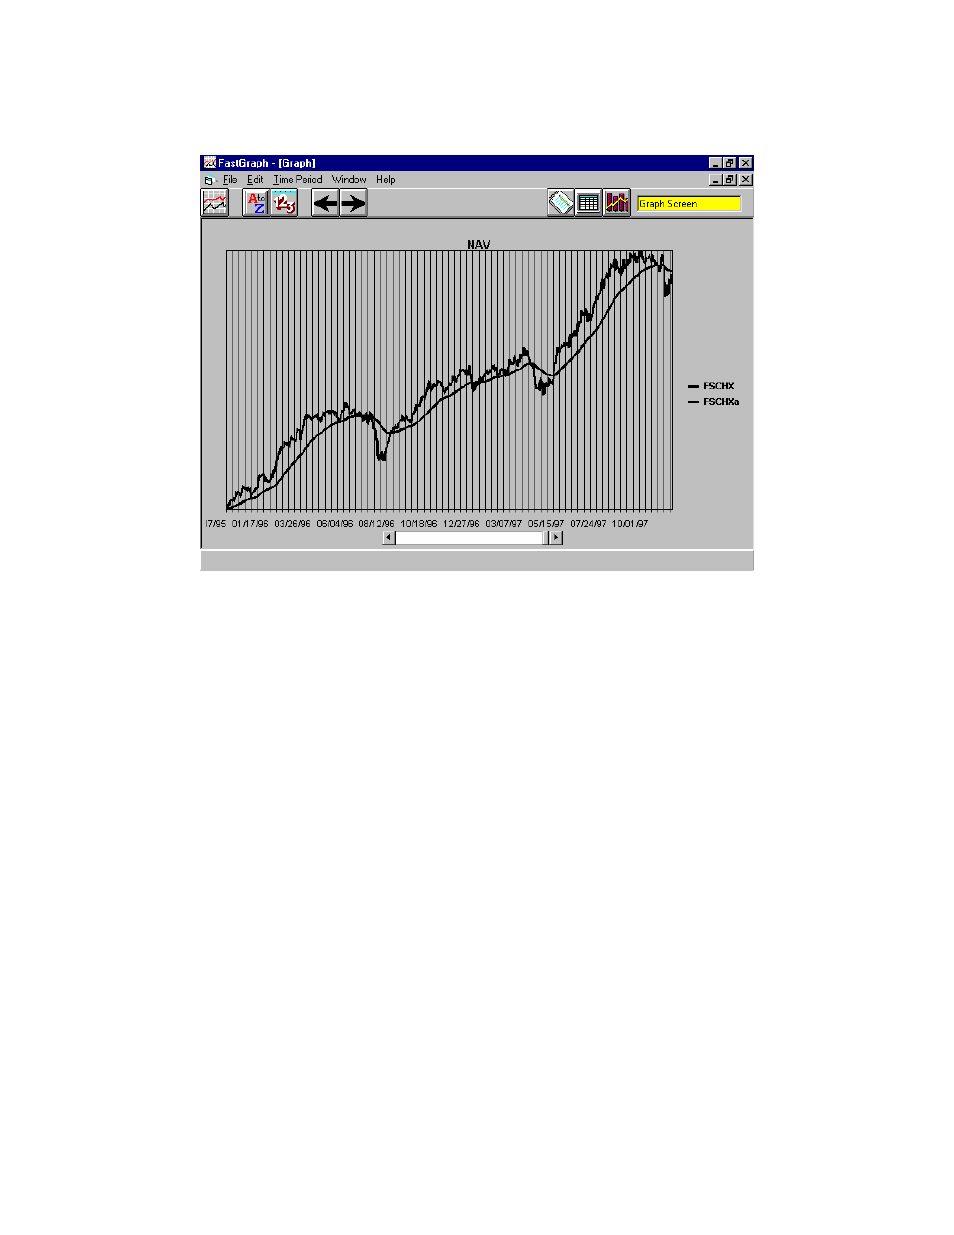
The following graph was made with a 50 day EMA and is displayed for a period of two
years:
The Adaptive Moving Average (AMA) can be displayed in the same way. See the Ap-
pendix for a description of AMA calculation.
FastTrack Example #3 - Parabolic
The Wilder parabolic is a very common technique to set a stop in trading. See Appendix
A for a description of how a parabolic is calculated.
To display a fund with its parabolic, first load a FastTrack family or individual funds.
Next, go to the Data screen spreadsheet and highlight the funds you want to display, go to
the main FastGraph screen and select Show Parabolic and enter the parameters to use in
the calculation. Determine if you want to show all the selected funds at once or one at a
time. Finally, click the graph icon.
The following graph was made with a starting acceleration value of 0.02, maximum value
of 0.2, and delta acceleration value of 0.0003 for a period of two years: