EdgeWare FastGraph Version 3 User Manual
Page 34
34
This menu will allow you to change the box size values (the defaults are from the Dorsy
book which is listed in the Resource chapter) and the Box Reversal values.
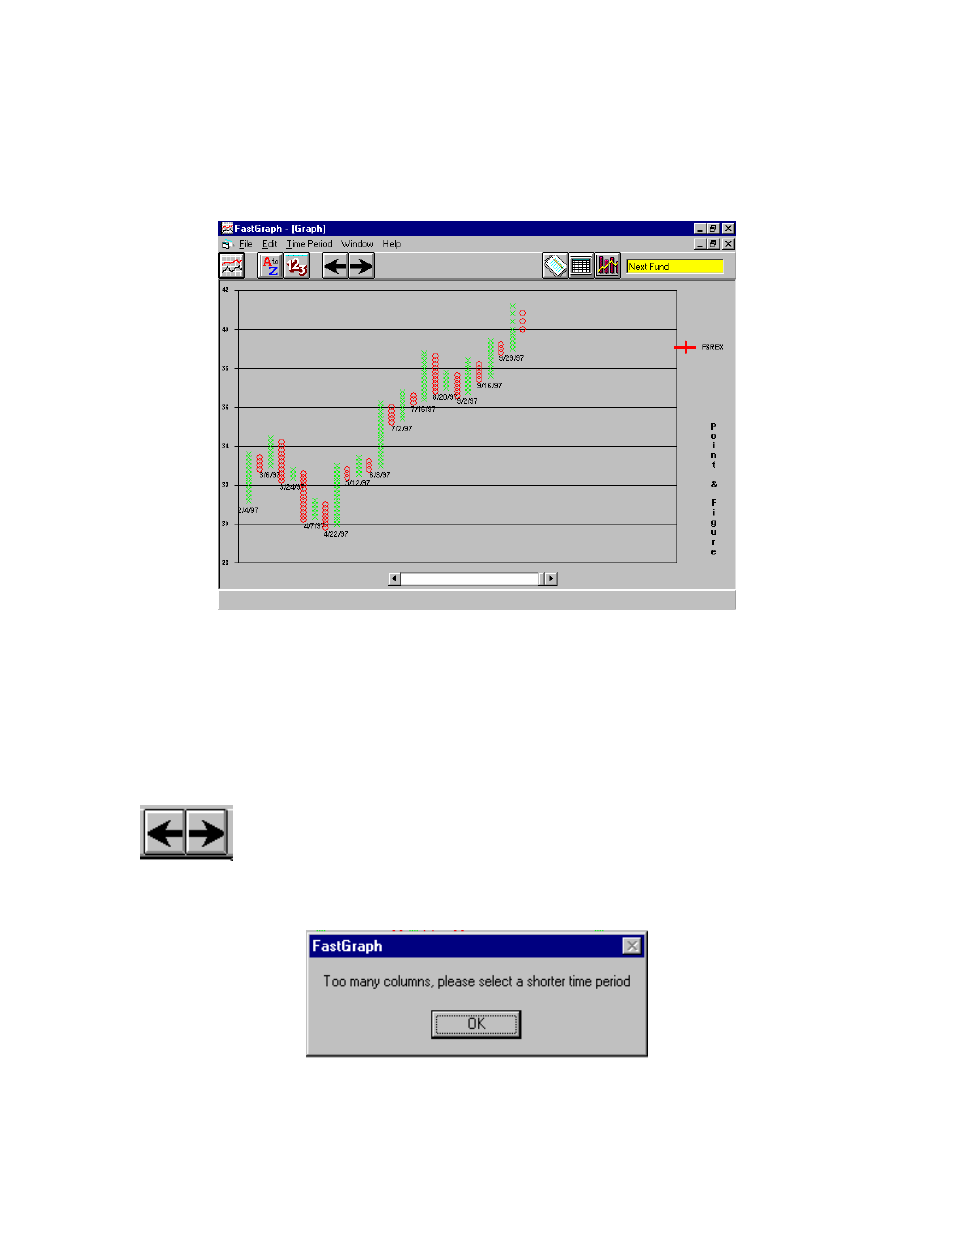
The next step is to select a time period range. The final step is to use the Graph icon to
see the chart:
To move through a family of funds, first load the family into FastGraph. Next, go to the
Data screen and “select” the columns for those funds you want to view. You can select
the entire family by quickly by clicking in the blank cell in the upper left corner (cell
A:1).
Select the Graph icon to chart the first P&F chart. Now you can review each of the funds
by using the:
icons to move forward and back through the funds you selected.
If you get the following message:
The time period selected contains too many columns of X&O’s. Select a shorter time
period using the Time Period menu.