EdgeWare FastGraph Version 3 User Manual
Page 17
17
Changing the Time Period Displayed
The slide bar at the bottom of the graph can be used to view different graph start and stop
times.
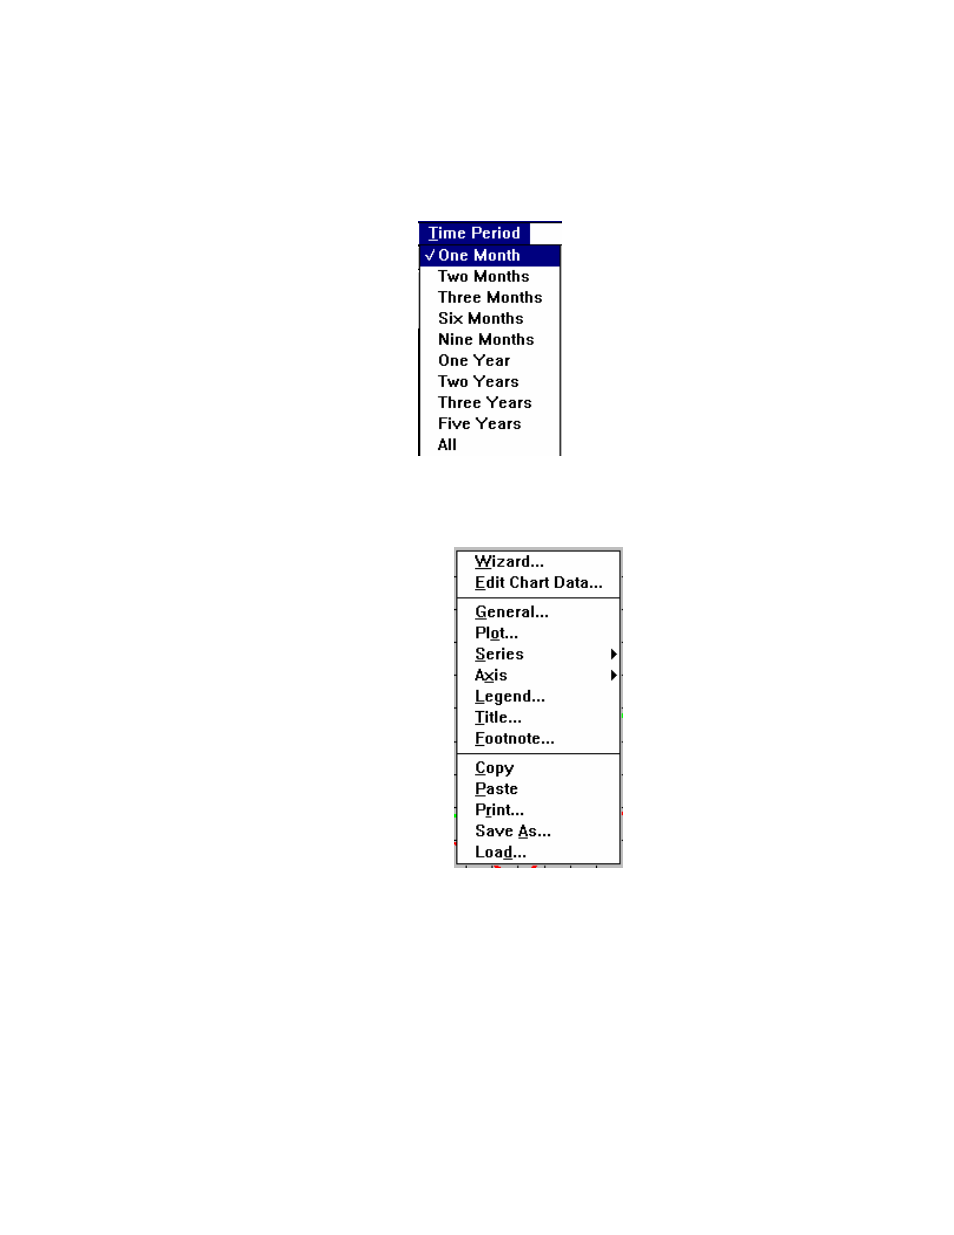
Changing the Graph Time Period
When FastTrack data has been selected the time period of the graph can be changed by
using the Time Period pulldown menu. A variety of time periods can be selected.
Printing the Graph and Other Options
Placed the cursor on the FastGraph Graph Tab screen and click the right mouse button.
The above menu is displayed. These options allow the graph to be printed as well as cus-
tomizing the graph. The graph can also be saved or a saved graph reloaded. The menu is
mostly self explanatory. One item that may deserve special note is the Edit Chart Data
option. This item will allow you to edit the data displayed on the chart.