Humboldt 5000 BLU Light Weight Deflectometer User Manual
Page 81
81
8.3.14 Print Statistical Analysis / Export as PDF File
To print the statistical analysis, click the button ‘PRINT ALL DATA RECORDS’ on the bottom right. To save
the statistical analysis as a PDF, use the button ‘ALL DATA RECORDS AS PDF’.
8.3.15 Google
®
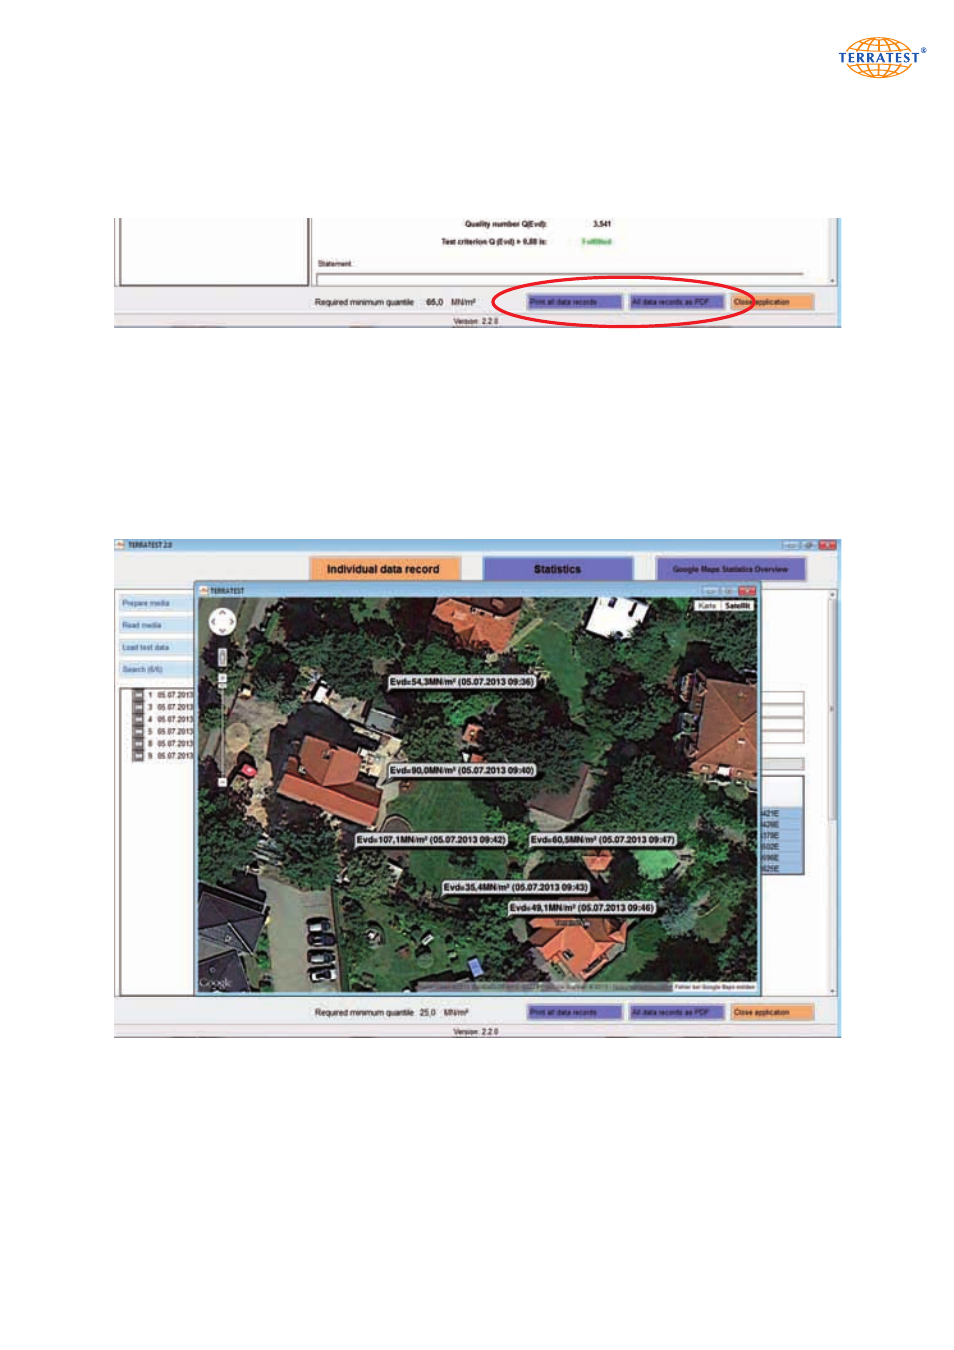
Maps Statistics Overview
In addition to the statistical analysis, a Google
®
Maps image showing all testing points included in the
statistical analysis can be displayed by clicking on the button ‘Google
®
Maps Statistics Overview’. The map
is equipped with the typical Google
®
Maps controls and can thus be scaled and switched between satellite
and map view. The method of marking each test point can also be alternated between the pin icon and ‘Evd
value, date, time’ by right-clicking on the map. There is also the option to print the map.
®
Maps representation of all testing points selected for the statistical analysis, including
information about the Evd value, and date and time of the test.