Bio-Rad Gene Pulser Xcell™ Electroporation Systems User Manual
Page 53
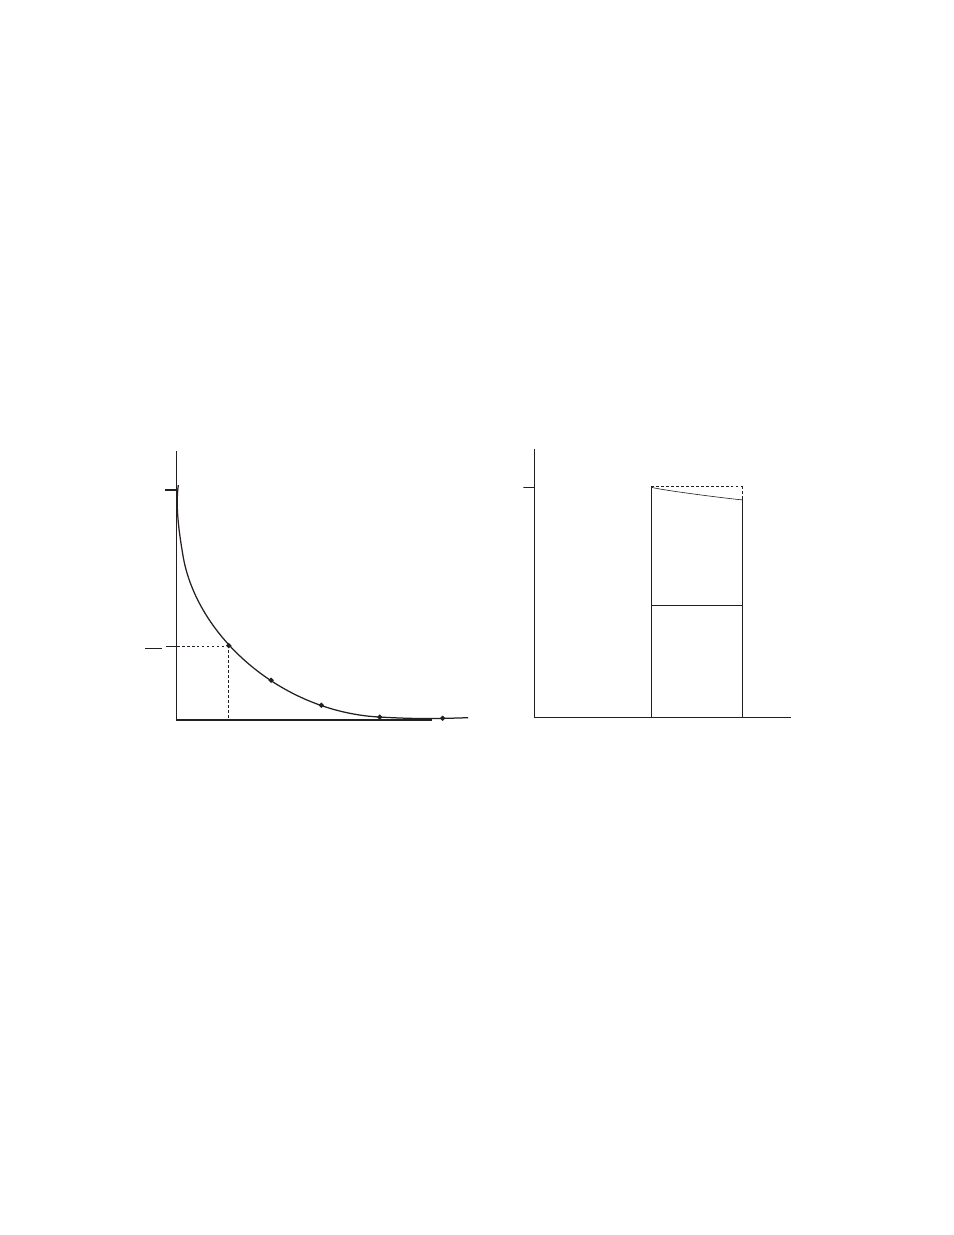
Table 4.1 Droop associated with pulse length at various sample resistances for the
high-voltage and low-voltage ranges for the Gene Pulser Xcell.
High voltage circuit
Low voltage circuit
Droop %
10
20
5
10
20
Sample
Resistance
Pulse length (msec)
Pulse length (msec)
(ohms)
20
0.051 0.109 0.223
3.34
7.14
14.6
200
0.510 1.09 2.23
33.4 71.4 146
1000
2.55 5.45 11.2
167
357 730
3500
8.93 19.1 39.0
585 1249 2556
.
Fig. 4.1. (A) Exponential decay pulse from a capacitance discharge system. When a capacitor,
charged to an initial voltage V
o
, is discharged into cells, the voltage applied to the cells decreases
over time in an exponential surve such that the voltage “V” at any given time “t” is given by
V = V
o
e
–(t/RC)
. In the special case where t = CR then V
o
/e. The value CR is known as the time con-
stant of the voltage decay. The shorter the time constant the faster the decay. (B) Square wave
pulse from a capacitance discharge system. The pulse length is the time the cells are subjected
to the discharge. During the pulse the voltage again decreases in an exponential decay so that at
the end of the pulse the voltage is lower than at the beginning. We call this drop in voltage the
pulse droop and measure it as a percentage of the initial voltage.
47
Time
V
0
V
0
t
V
t
ττ
V
0
e
Time
V
olta
g
e
(V)
V
olta
g
e
(V)