Bio-Rad Gene Pulser Xcell™ Electroporation Systems User Manual
Page 24
18
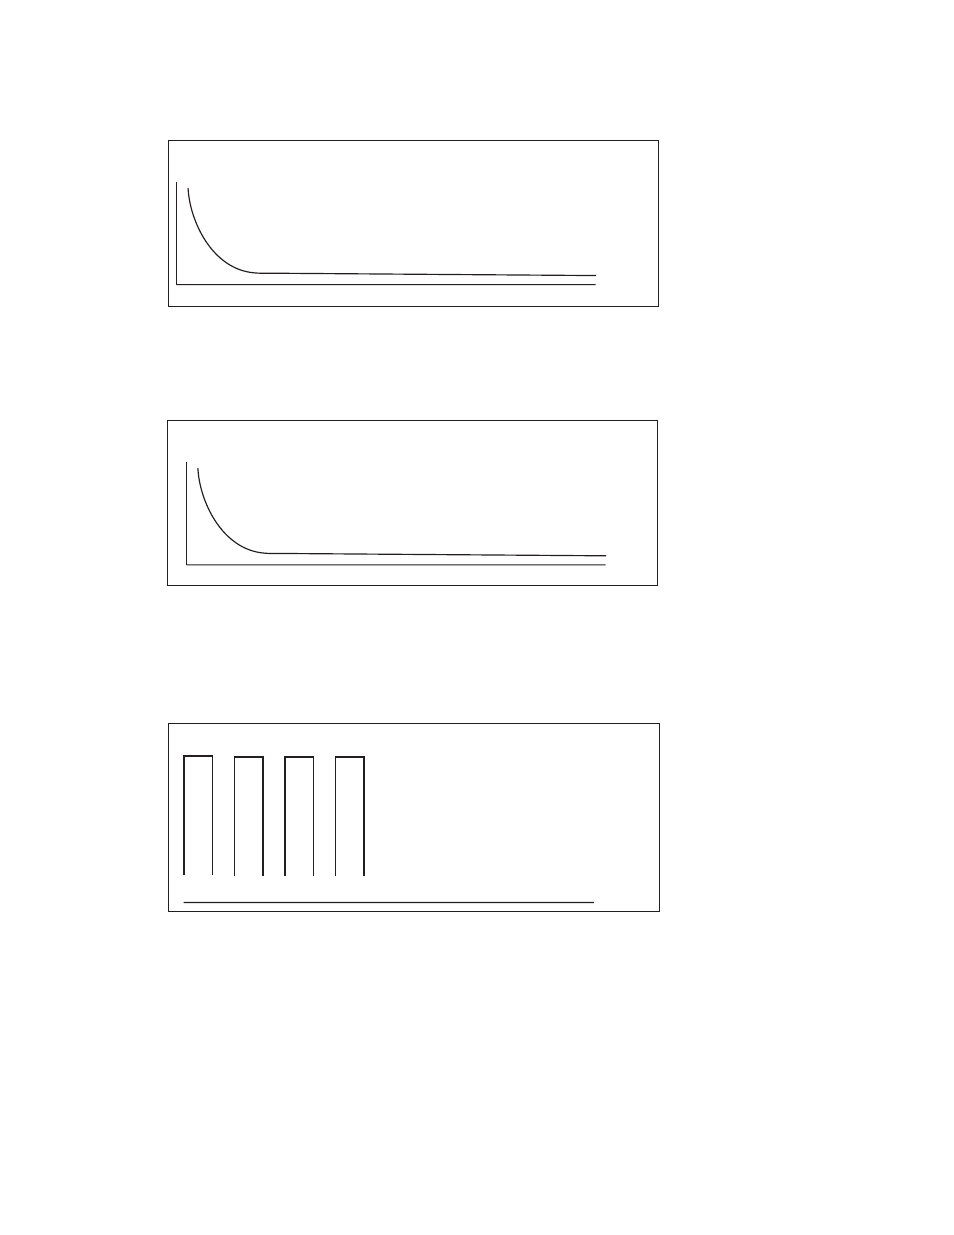
Exponential Decay: Results Screen
Fig. 3.6. Exponential Decay Protocol Results screen. The graph shows the exponential decay
pulse. The table gives the calculated time constant (TC) and the delivered voltage (Voltage).
Time Constant: Results screen
Fig. 3.7. Time Constant Protocol Results screen. The graph shows the exponential decay pulse.
The table gives the delivered time constant (TC) and voltage (Voltage) as well as the selected
capacitor (Capacitance) and resistor (Resistance).
Square Wave: Results screen
Fig. 3.8. Square Wave Protocol Results screen. The graph shows the square wave pulse; note
that the x-axis may not be to scale. The table gives the actual pulse length (Pulse Length), the
delivered voltage (Voltage), the calculated droop (% Droop), and, when multiple pulses are given,
the pulse interval (Interval) and the number of pulses (Number).
R e s u l t s : E x p o n e n t i a l D e c a y
T C ( m s e c ) X X X X . X
V o l t a g e ( V ) X X X X
R e s u l t s : T i m e C o n s t a n t
T C ( m s e c ) X X X X . X
V o l t a g e ( V ) X X X X
C a p a c i t a n c e ( u F )
X X X X
R e s i s t a n c e ( o h m s )
X X X X
R e s u l t s : S q u a r e W a v e
V o l t a g e
X X X X
P u l s e L e n g t h
( m s e c ) X X X . X X
I n t e r v a l X X . X
N u m b e r X X
% D r o o p X X