Bio-Rad S3™ Cell Sorter User Manual
Page 80
70 | S3 and S3e Cell Sorters
Sorting
Table 25 describes the available sort statistics. Each statistic is sort-stream specific. The Sort
Statistics window can be placed in the workspace for printing. Sort statistics are saved within
the FCS file.
Table 25. Description of sort statistics.
Statistics
Definition
Sort logic
The regions used to identify the populations to sort
Mode
The sort mode used for sorting left or right
Current target
The sort target position used during the sort
Sort count
The current number of positive events sorted
Sort volume (ml)
The volume sorted into each tube/well. This does not include the media placed
in the tube prior to sorting
Abort count
The current number of positive events aborted
Sorts per second
The sort count per second as a rate
Aborts per second
The abort count per second as a rate
Sort %
Number of sorted events divided by total events x 100
Abort %
Number of aborted events divided by total events x 100
Efficiency
Number of sorted events divided by the sum of sorted and aborted events x 100
Event rate
Real-time events per second during the sort
Total events
Total events acquired during the sort
Sort time
Sort time elapsed
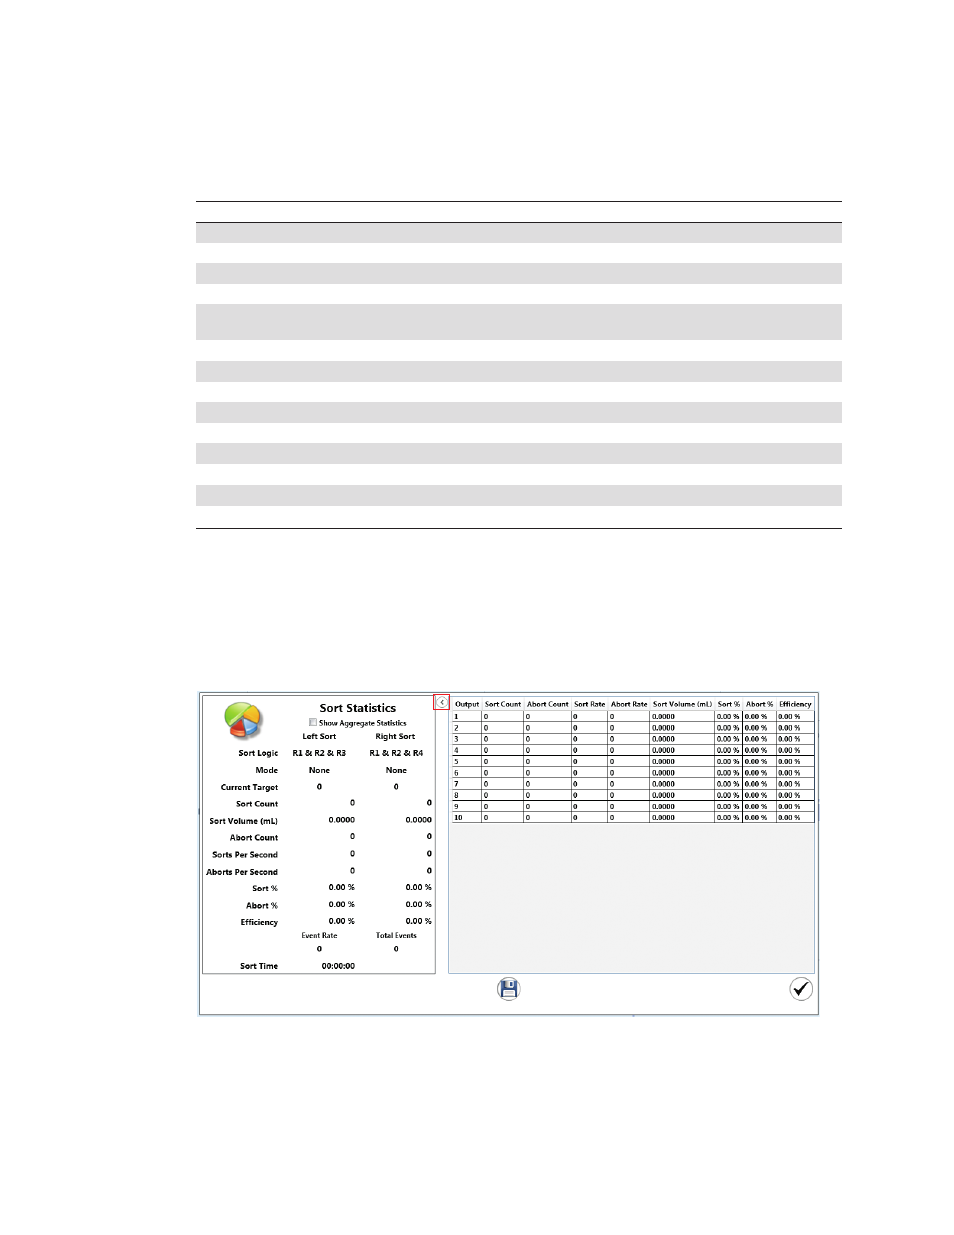
Additional information can be shown in the Sort Statistics window by using the arrow on the
upper right hand side of the window. This will expand the window to show a table listing the
data for each tube during the run. There are up to ten outputs equivalent to five tubes in two
directions. This information can be saved as a tab-delimited file using the save button located
in the lower right corner of the window. This information is automatically stored in the FCS file.
Fig. 76. Sort Statistics window expanded to reveal additional information.