Moisture sensor data, To display the soil moisture sensor data report, Water used – Baseline Systems BaseStation 3200 User Manual
Page 85: To display the water used reports
BaseStation 3200 Advanced Irrigation Controller Manual
Moisture Sensor Data
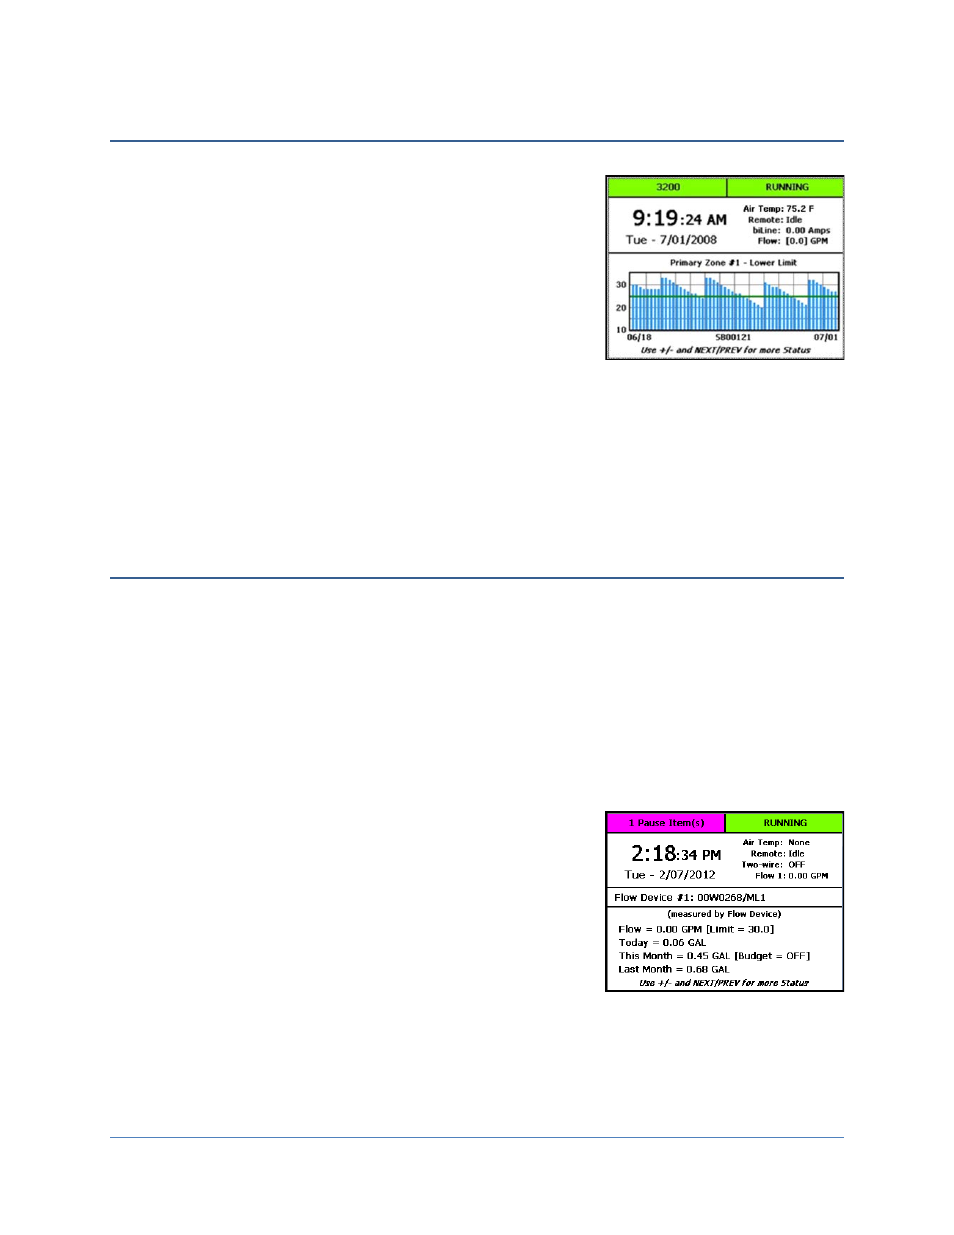
The Soil Moisture Sensor Data report shows a moisture graph for each of the moisture sensors connected to the
controller.
The graph shows the watering limits:
• Green line = lower limit – Allow watering at the next start time when
the moisture has dropped below this limit
• Red line = upper limit – Stop watering during a water cycle when the
moisture reaches this limit
To display the Soil Moisture Sensor Data report
1. Press the NEXT button twice from the main screen.
2. Press the + or – button to change the biSensor that is being displayed. The sensor number displays below the
graph.
3. To change the moisture range displayed on the graph, press the ENTR button. The range changes by 5% each
time you press the button.
4. To return to the main screen, press the CLR button.
Water Used
The BaseStation 3200 provides two types of water used reports.
• Report for controllers that do not have a flow sensor
In this report, all flow and water used values are estimated from the flow values for each of the zones. The
flow is the sum of the individual flow values for each of the zones that are currently watering. The water used
is the sum of the flow rate of each zone times the water time (for example, 15 GPM x 30 MIN = 450 GAL).
• Report for controllers that have one or more flow sensors
This report indicates the actual flow measured, and the actual water used that has been accumulated by the
flow biCoder. These values are determined by the combination of the flow sensor, its configuration, and its
accuracy.
To display the Water Used reports
1. Press the NEXT button three times from the main screen.
2. Press the + or – button to scroll through each of the flow reports.
3. To return to the main screen, press the CLR button.
Page
77