Status bar, Network view tabs, Routing view – ClearOne Dante Controller User Manual
Page 32: Routing

Dante Controller User Guide
Copyright © 2014 Audinate Pty Ltd. All rights reserved.
-32-
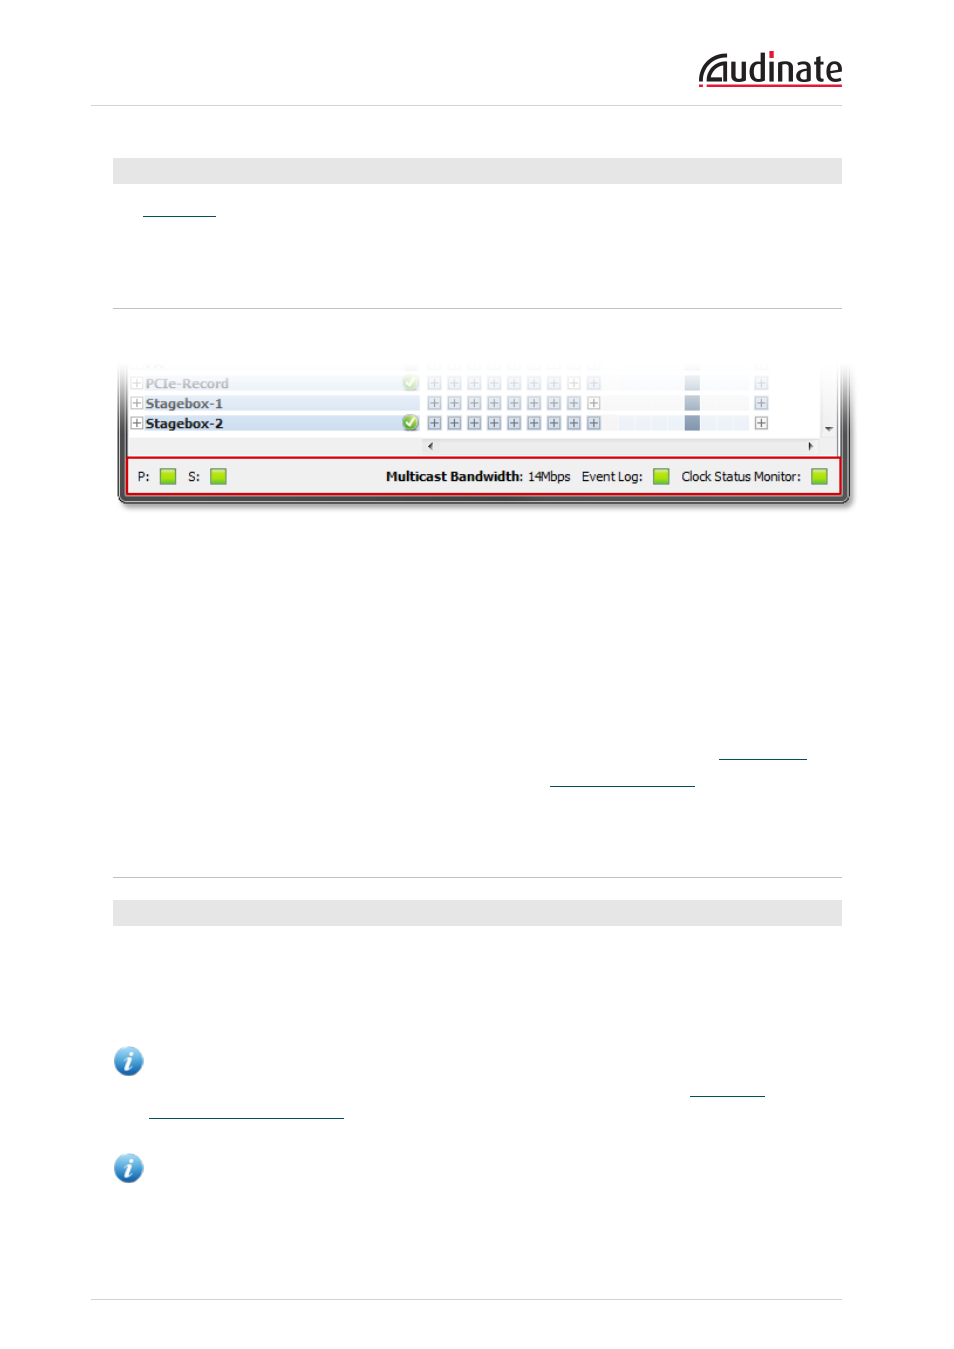
Status Bar
The
displays notifications for network status, general device events, and clock status events,
plus the current Dante audio multicast bandwidth on the network.
Status Bar
The Status Bar displays the following information:
n
P: The current status of the Primary network. Green indicates that Dante Controller is currently con-
nected to the primary Dante network. Red indicates a problem with the connection.
n
S: The current status of the Secondary Dante network. Only displayed where a secondary network is
connected.
n
Multicast Bandwidth: The current Dante audio multicast bandwidth on the connected networks.
Note that there may be network traffic from other sources that is not included in the multicast band-
width reading.
n
Event Log: Indicates the current status of the event log. Click the icon to open the
n
Clock Status Monitor: Indicates the current status of the
. Click the icon to
open the Clock Status Monitor.
Network View Tabs
Routing View
When Dante Controller is started, it always displays the Routing Tab within the Network View. In this view
the network is shown in the form of a grid. Devices with Tx channels are displayed along the top row of the
grid, and those with Rx channels are displayed along the left-hand column of the grid. Initially a collapsed
view is presented; individual channels cannot be seen.
Note: If a device name is shown in red, it means Dante Controller has automatically detected an
error condition. Double-click the device name to see more information. Refer to
for further explanation.
Note: If a device has Tx and Rx channels, it is shown both along the top row of the grid and also
along the left-hand edge.
