Figure 22, An374 – Cirrus Logic AN374 User Manual
Page 29
AN374
AN374REV2
29
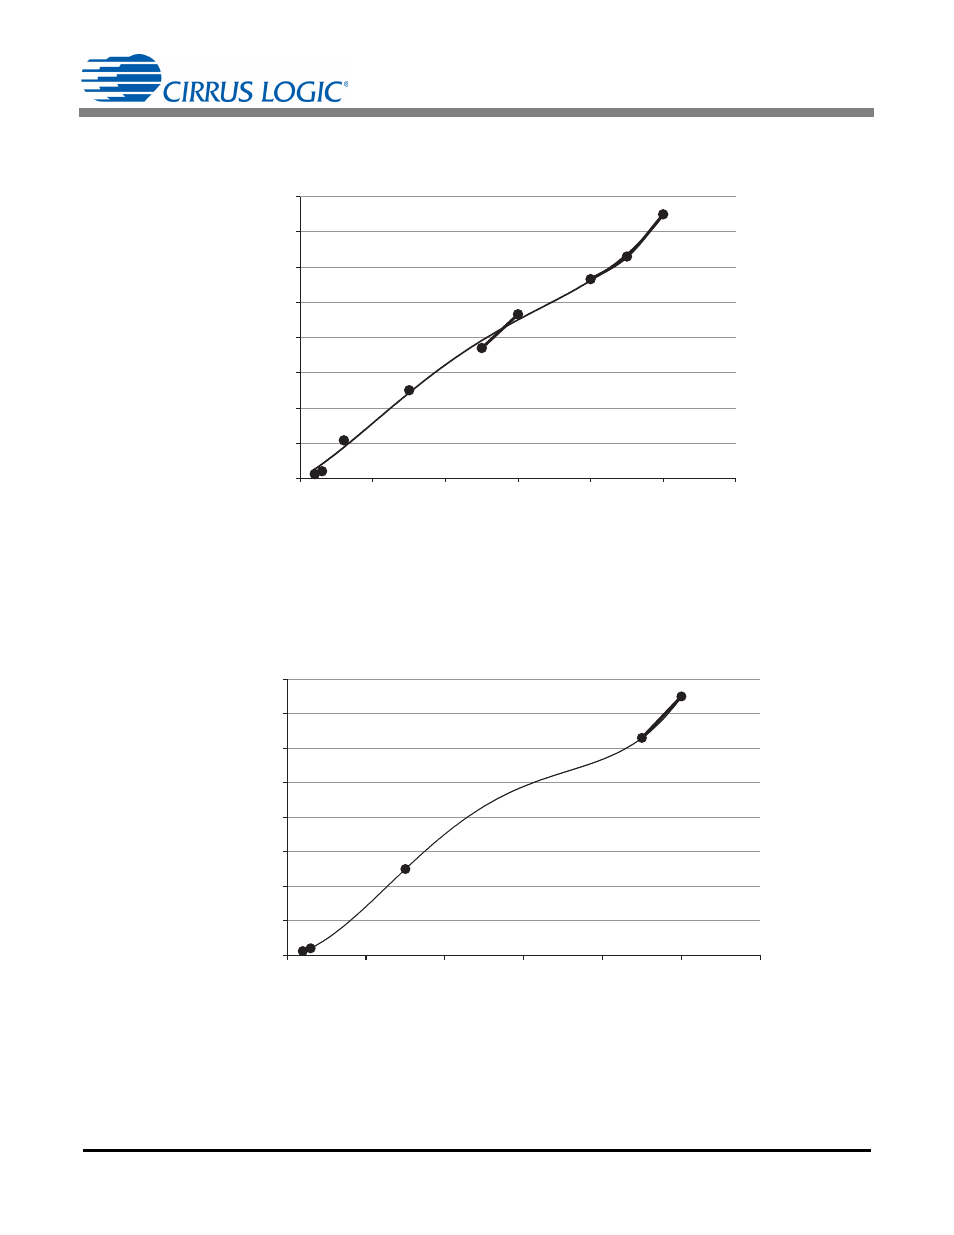
previous sections. If some of the points in the middle region of the dimming curve are removed, then the fit can
be significantly improved in the other regions of interests.
By removing the points of interest, the dim map is reconstructed as illustrated in Figure 23. It can be seen that
even without remapping the dim axis, the points that were considered critical could be fitted. The error between
the requested data and the actual suggested fit is shifted to the region between 25% to 40% dim at which point
the bulb is bright enough to not be able to spot the anomalies of being away from the Planckian locus.
Step 6) Weighted fit to increase accuracy in the region of interest.
Once the data has been collected, the weighting function and the corresponding weights can be chosen to
increase the weights in a specific region. This forces the curve fitter to minimize the error in this region
improving the fit in the region of interest.
y = 887.97x
4
- 1549x
3
+ 733.71x
2
+ 301.04x
R² = 0.9969
0
50
100
150
200
250
300
350
400
0.00
0.20
0.40
0.60
0.80
1.00
1.20
Output Cur
rent
(mA
)
Dim
Figure 22. Best Fit Trendline for a Light Engine
y = 1974x
4
- 3827.1x
3
+ 2171.9x
2
+ 56.207x
R² = 1
0
50
100
150
200
250
300
350
400
0
0.2
0.4
0.6
0.8
1
1.2
Output Cur
rent
(mA
)
Dim
Figure 23. Reconstructing the Dim Map