An374 – Cirrus Logic AN374 User Manual
Page 28
AN374
28
AN374REV2
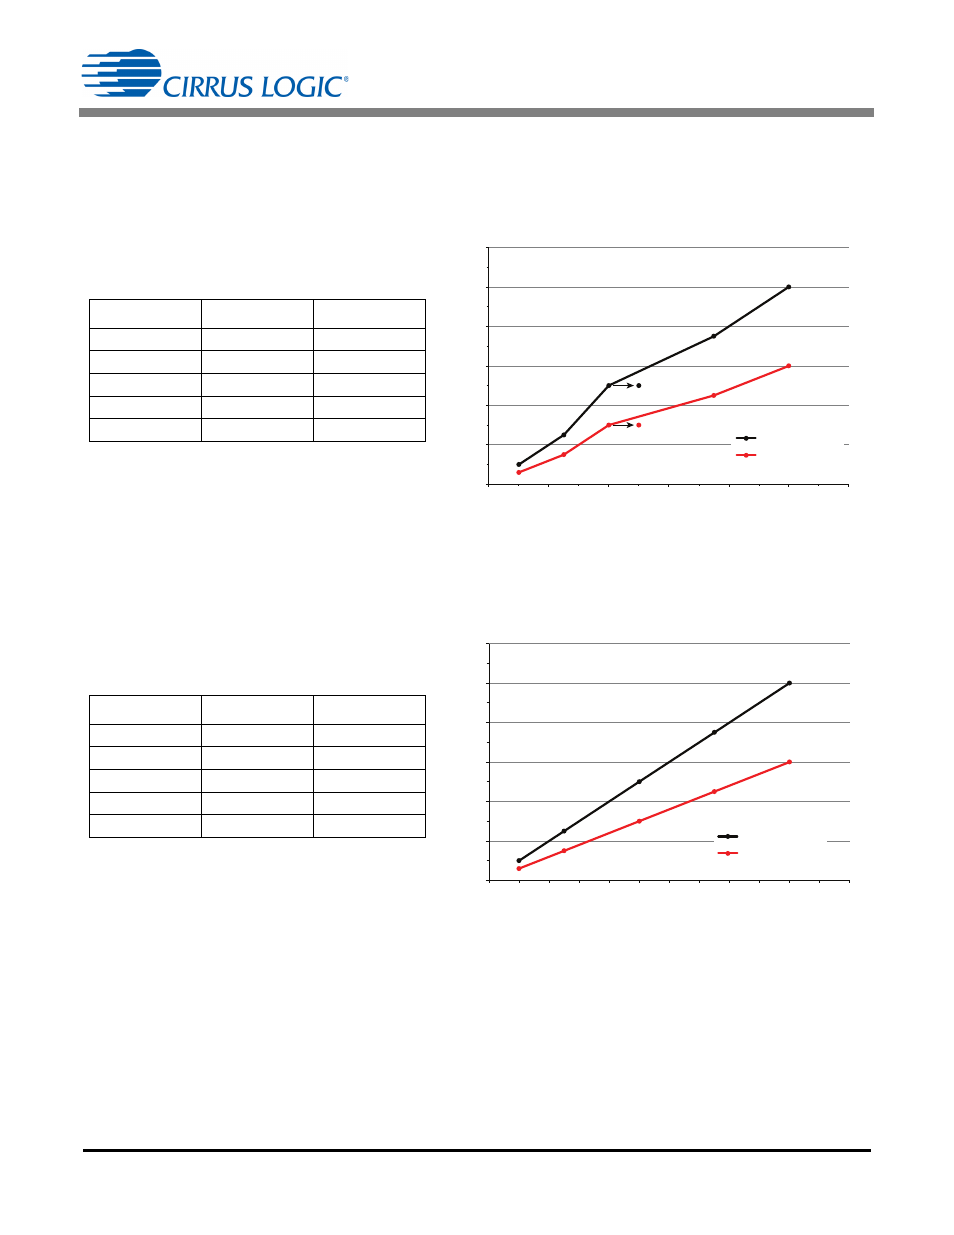
When re-mapping the dim axis, remember the following points:
• The dim axis needs to be remapped to the white current and the red current axis simultaneously.
Otherwise, the data will be altered.
• In the plot in Figure 20 it can be seen that the data point is to the left of the trendline for the red current and
the white current. Moving the dim axis helps mitigate the problem under these circumstances.
• If the red point and the white point were tending in the opposite way, remapping the dim axis to the center
could split the error for the same polynomial. One can change the shape of the trendline used for either one
of the curves by changing its order and then again attempting to remap the dim axis to see if a better fit can
be achieved.
Step 5) Eliminating points outside the region of interest
If remapping the dim axis does not provide sufficient results, then eliminate the points that are outside the
region of interest and see if the trendline can provide a more acceptable fit. The order of the polynomial that
is used can be different for the red and the white and one can by trial and error see if moving to a higher order
polynomial can improve the fit. An example below is shown to better understand the point.
Figure 22 shows raw data for a light engine system and the best fit trendline. It can be seen that the trendline
is off at a number of points in the low end. As discussed earlier the curve should be accurate at the low dim
range and yet should be accurate at full brightness. The currents should be always > 0 as discussed in the
0.05
0.125
0.25
0.375
0.5
0.03
0.075
0.15
0.225
0.3
0
0.1
0.2
0.3
0.4
0.5
0.6
0
0.2
0.4
0.6
0.8
1
1.2
Dim (%)
LED Current
(A
)
Red LED Current
White LED Current
Figure 20. White and Red LED Current vs Dim
Notes:
1. Based on relative brightness.
I
White
(mA)
I
Red
(mA)
0.10
0.050
0.030
0.25
0.125
0.075
0.40
0.250
0.150
0.75
0.375
0.225
1.00
0.500
0.300
0.05
0.125
0.25
0.375
0.5
0.03
0.075
0.15
0.225
0.3
0
0.1
0.2
0.3
0.4
0.5
0.6
0
0.2
0.4
0.6
0.8
1
1.2
Cur
rent (A
)
Dim (%)
White LED Current
Red LED Current
Figure 21. Corrected White and Red LED Current vs Dim
Notes:
1. Based on relative brightness.
I
White
(mA)
I
Red
(mA)
0.10
0.050
0.030
0.25
0.125
0.075
0.50
0.250
0.150
0.75
0.375
0.225
1.00
0.500
0.300