3 methods to collect required data, 1 experimental measurement in lab, 2 simulation – Cirrus Logic AN374 User Manual
Page 23: 1 experimental measurement in lab 6.3.2 simulation, Nd 15, An374
AN374
AN374REV2
23
Note that any variation of the white string should be compensated for by changing the currents in the other
string so that the correct lumen and CCT are maintained across the entire temperature range of interest. At
this point, both the currents of the white LED across dim and the data represented in Figures 14 and 15 should
be available for the design.
6.3 Methods to Collect Required Data
The following sections describe the methods to collect the necessary data required for performing curve fitting.
6.3.1 Experimental Measurement in Lab
Experimental measurements are the most robust way to collect data. However, it is time consuming and
requires expensive test equipment. It also requires the final light engine that is to be used for the design. The
thermal resistance between the LED junction and the NTC should be known. In other words, the NTC should
be placed at its final location to best mimic the thermal resistance. The light engine should be placed in an
integrating sphere and characterized. For example, specifications with regards to CCT, Cx, Cy, lumens, and
CRI can be measured.
Each output string is connected to an independent DC source that can source the required voltage and
currents. The currents are experimentally changed until the desired points 1, 2, and 3 are obtained on
Figure 11. At each of these points, measure the NTC resistance when it stabilizes to a constant value. If the
NTC is not placed, then a thermocouple can be placed close to where the NTC will be placed and the
temperature can be recorded.
The process should be repeated at various ambient temperatures. The entire data is collected across the
various ambient temperatures to cover the thermal operating point space of the LEDs, which it is forced to
traverse during transients (even though the actual ambient temperature is not what was specified in the
spreadsheet). For example, it can alleviate the color shift problem at cold startup,
as discussed in
sectionTranslation into Input Specifications for Calculating Color Gains on page 21.
Another advantage of this approach is that it naturally compensates for any variation in the behavior of the
other string across the various ambient temperatures by adjusting the two strings accordingly. Performing this
experiment of accurately measuring the data across various ambient temperatures using an integrating sphere
is not easy.
6.3.2 Simulation
Some of the designs can be done on the spreadsheet if at the least the following are available:
• Theoretical models for LED behavior across junction temperature
• Thermal model of the junction to NTC temperature thermal resistance
• NTC model
• Good optics and reflector model with respect to diffuser and LED beam angles
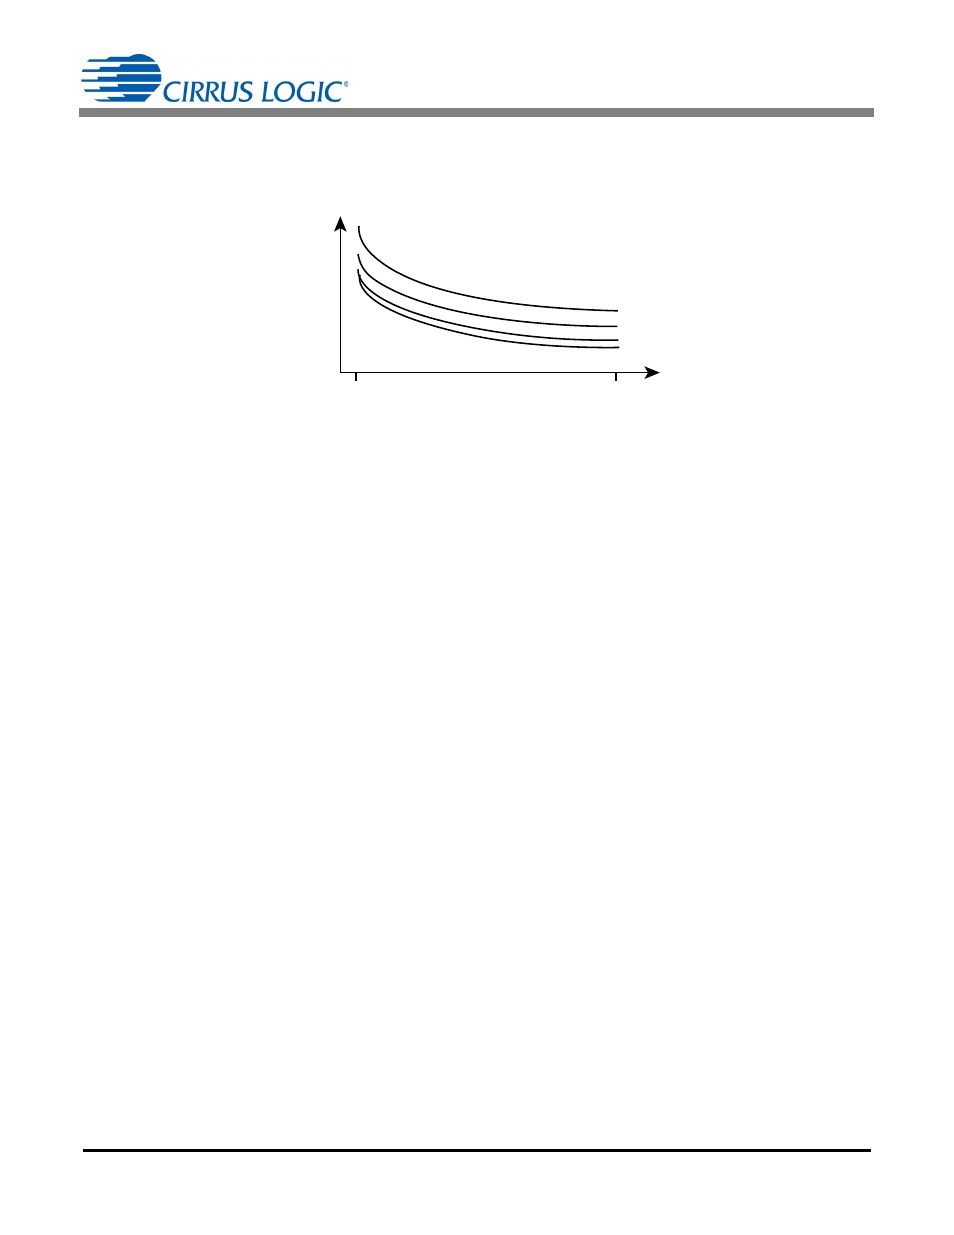
0.02
1.0
Dim
T
amb
= 5°C
T
amb
= 25°C
T
amb
= 40°C
T
amb
= 55°C
NTC Resistance (
:
Figure 15. NTC Codes Across Dim at Various Ambient Temperatures