Bell & Gossett 10-001-278 XLS Integrated Pump Controller User Manual
Page 23
23
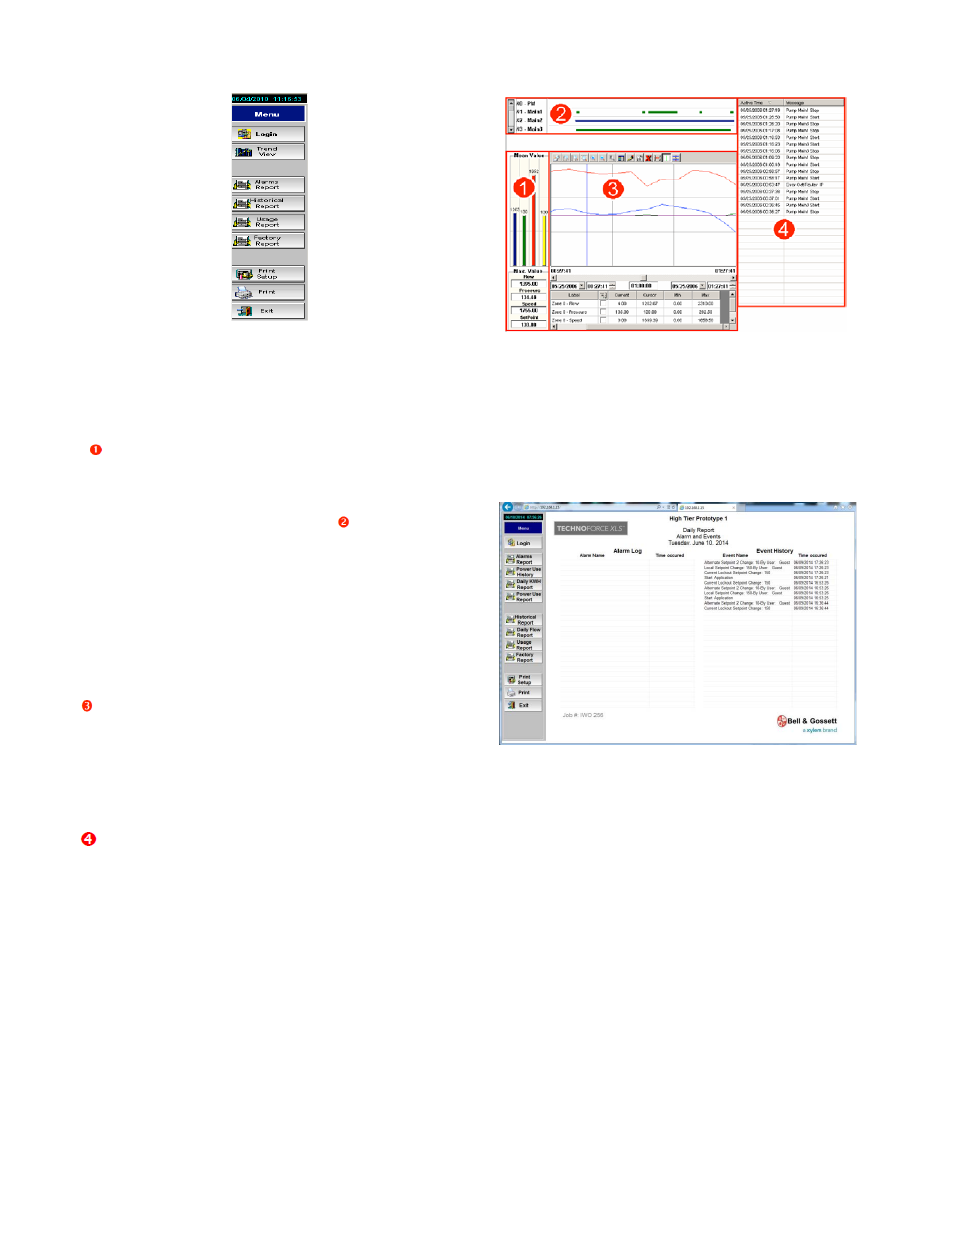
Figure 53: Web Reports Menu
Trend View
Select [Trend View] from the Web Reports Menu.
There are four key parts to the trends screen.
Mean Value Graph and Detail: For each of the
key variables (Flow, Pressure, Speed, and
Setpoint) the mean values are displayed as a
vertical bar graph on the top while the Maximum
values are displayed in fields below.
Pump Run
Log: Graphically displays the pump operation for
the time frame selected. These are color coded:
•
Green - indicates pump is running
•
Blue - indicates pump is running on
VFD.
•
Red - indicates pump is in a fault
condition.
Variables Graph: Line graph displays color- coded
information for key variables over a specified time.
The top bar of the graph also has zoom, period, and
legend options. The grid below displays variable data.
Click […] to choose line colors. Choose the start date,
time and duration for the graph from fields positioned
between the graph and grid.
Events Listing: Details the time and events for a
duration time defined by the user, as for the variables
graph.
Figure 54: Trends View
Alarms Report
Select [Alarms Report] from the Web Reports
Menu.
Alarms Report allows you to view the last 10
system alarms and events.
Figure 55: Alarms & Events
All reports can be printed using [Print], after a printer
has been set up by clicking on [Print Setup].
Historical Report
Select [Historical Report] from the Web Reports
menu.
Historical Report allows you to access the data and
bar graph representation of your station’s Annual,
Monthly, and Weekly Flow information. The actual
gallons are shown in the data table on the left, and
three bar graphs (annual, monthly, and weekly) on
the right.
All reports can be printed using [Print], after a printer
has been set up by clicking on [Print Setup].