6offloading and data visualization – NOVUS LogBox-RHT User Manual
Page 3
LogBox-RHT
NOVUS AUTOMATION
3/6
End of readings: Options for the end of readings are:
•
Full Memory: readings can be stored up to the full
memory capacity is reached.
•
Wrap around: readings are continuous, replacing old
registers by new ones as the number of readings
overpass the memory capacity.
•
After: the logger stops readings after a certain number of
readings.
•
Date: Readings stop at user-predefined date and time. In
case the logger memory capacity is reached before the
date defined, readings are stopped.
5- Channels: Shows parameters referring to each channel
separately. Channel 1 is the Temperature channel, and Channel 2
the Relative Humidity channel.
Tag: Defines a name for the temperature registers.
Value: It defines how the value measured will be logged. Options
are:
•
Instantaneous: The value logged will be exactly the value
measured at each interval defined. The minimum interval
between measurements is 1 second.
•
Average: The value logged will be the mean of ten
consecutive measures taken within a predefined interval.
The minimum interval between measurements is 10
seconds.
•
Maximum: The value logged will be the maximum value
found within ten consecutive measurements taken within a
predefined interval. The minimum interval between
measurements is 10 seconds.
•
Minimum: The value logged will be the minimum value
found within ten consecutive measurements taken within a
predefined interval. The minimum interval between
measurements is 10 seconds.
Offset: Makes possible to correct the value logged.
Unit: Defines the unit of the value measured: ºC or ºF for
channel 1 (temperature) and only % for channel 2 (relative
humidity).
Alarm: Available only in the temperature channel. Defines limit
values that, when exceeded, characterize an alarm condition.
Alarm events are informed to the user through a flashing mode
of the Alarm Indicator.
Input: Parameter available only in channel 2 (humidity). With this
parameter it is possible to disable the humidity measurement,
saving all memory capacity for temperature measurement.
After filling all the fields select OK and settings are sent to the logger.
6
OFFLOADING AND DATA VISUALIZATION
The transference of data to a PC is accomplished with the LogChart
II software. Measurements are displayed in tabular and graphical
form. Data can be saved in files for future analysis and comparisons.
6.1
Offloading data
Data offload is accomplished by clicking the button Offload Data:
and placing the communication interface towards the frontal part of
the logger. During data transference, a status bar indicates remaining
data to be transferred. Data offloading time is proportional to the
number of readings logged.
6.2
Visualizing data
At the end of values transfer, data can be displayed in a graphical
form.
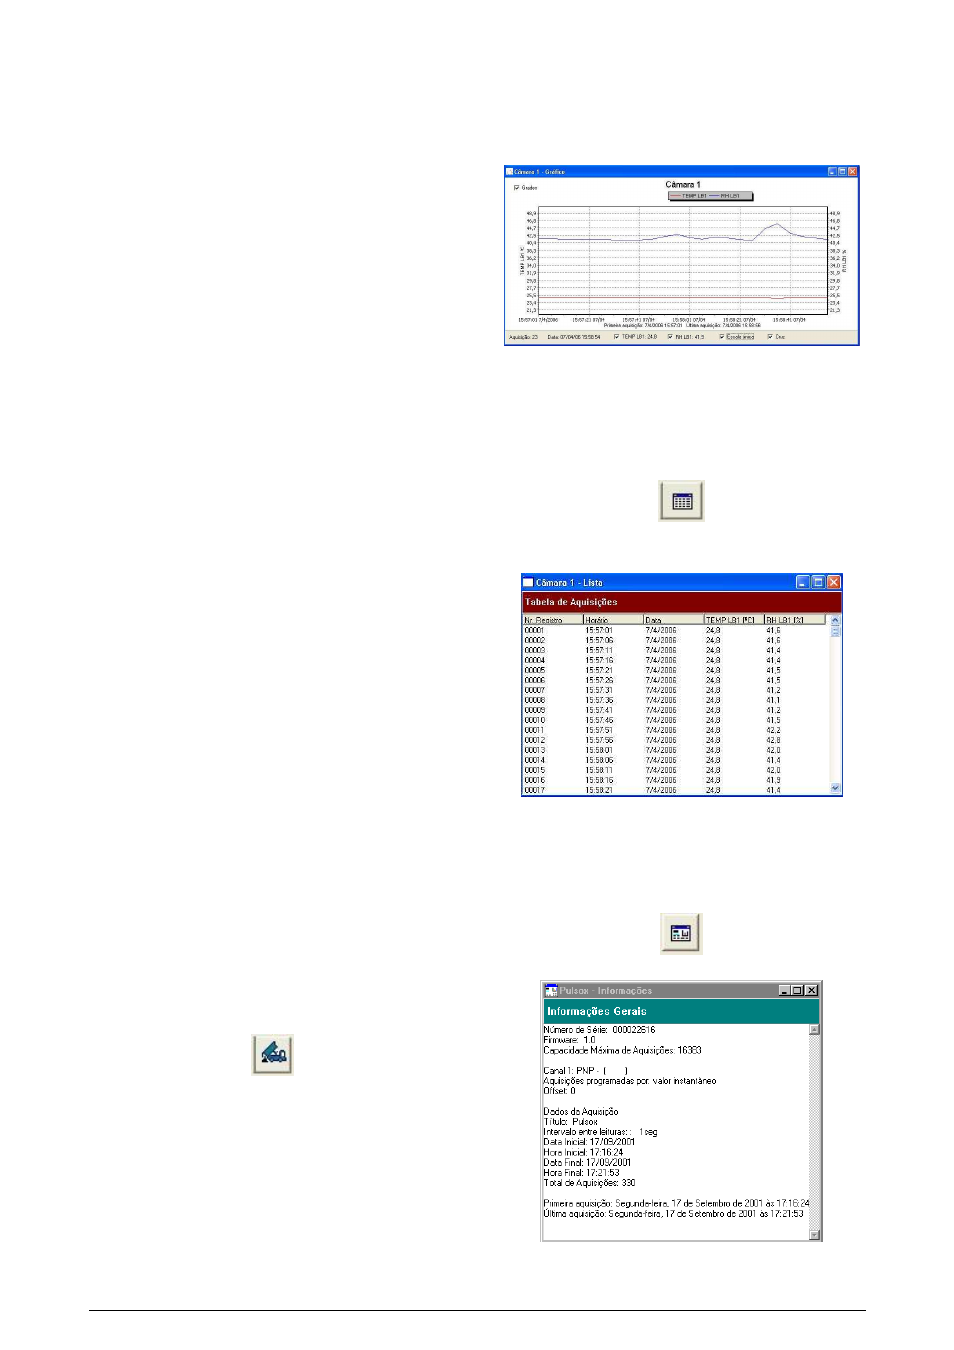
6.2.1
Chart window
It is possible to select a region of the chart to zoom in. Zoom
commands can be accessed through the View menu or through
zoom icons from the task bar. It is also possible to select an area
from the chart to zoom in by clicking and dragging the mouse, thus
creating a zoom region starting from the upper left corner on the
chart area.
The graphic curves can be vertically dragged with a right-click and
dragging the mouse up and down.
Figure 08 - Chart window.
Offloading measurements does not stop the process of data logging
and reading.
6.2.2
Measurements Table Window
To display measurements in a tabular form, press the icon Table
View:
Values are presented in a tabular form, listing the measurement time
and value.
Figure 09 – Screenshot showing the measurement table
6.2.3
General information table
This window shows some information about the logger whose data
were just read and its configuration. The screen can be displayed by
pressing the icon Parameters Visualization:
Figure 10 – General Information window