CatEye e-TrainData™ Ver.3 [Power Unit Edition] User Manual
Page 50
50
e-Train Data V3
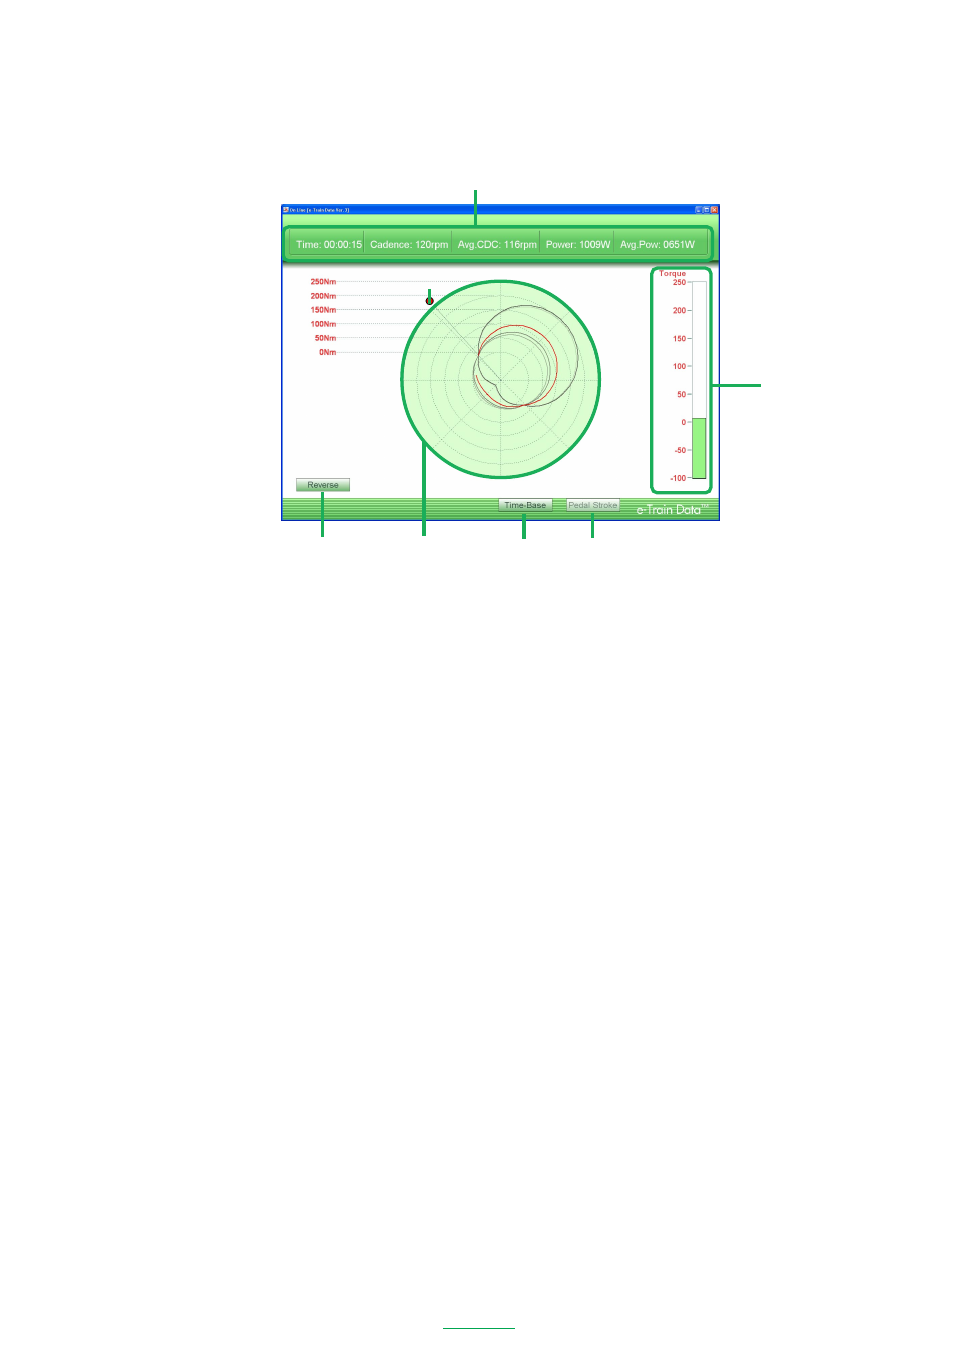
Pedal Position Dependent Graph
The Pedal position dependent graph displays an easy-to-read graph of torque distribution throughout each
pedal stroke.
The following functions are available in the Pedal window:
Details -------------------- Displays the exercise duration, current cadence, average cadence, current power
and average power of the data that is currently measured.
Torque level -------------- Displays the current torque with a bar. The color changes by torque level.
CDC sensor position ---- Indicates the position of the CDC sensor. You can drag it to the position where the
CDC sensor is installed.
Torque transition graph ---- The latest torque level is displayed in red. As the time elapses, the color lightens.
Time Base ---------------- Opens the Time dependent graph..
Pedal Stroke ------------- Disabled as you are already in this window.
Reverse ------------------- Reverses the torque transition graph symmetrically.
With the mouse cursor, click and drag the red dot representing the cadence sensor to a position relative to the
position of the cadence sensor on the bicycle. This will give a more accurate depiction of the pedal stroke.
Details
Pedal Stroke
Time Base
Torque level
Reverse
Torque transition graph
CDC sensor position