Displaying power zones – CatEye e-TrainData™ Ver.3 [Power Unit Edition] User Manual
Page 37
37
e-Train Data V3
DISPLAYING POWER ZONES
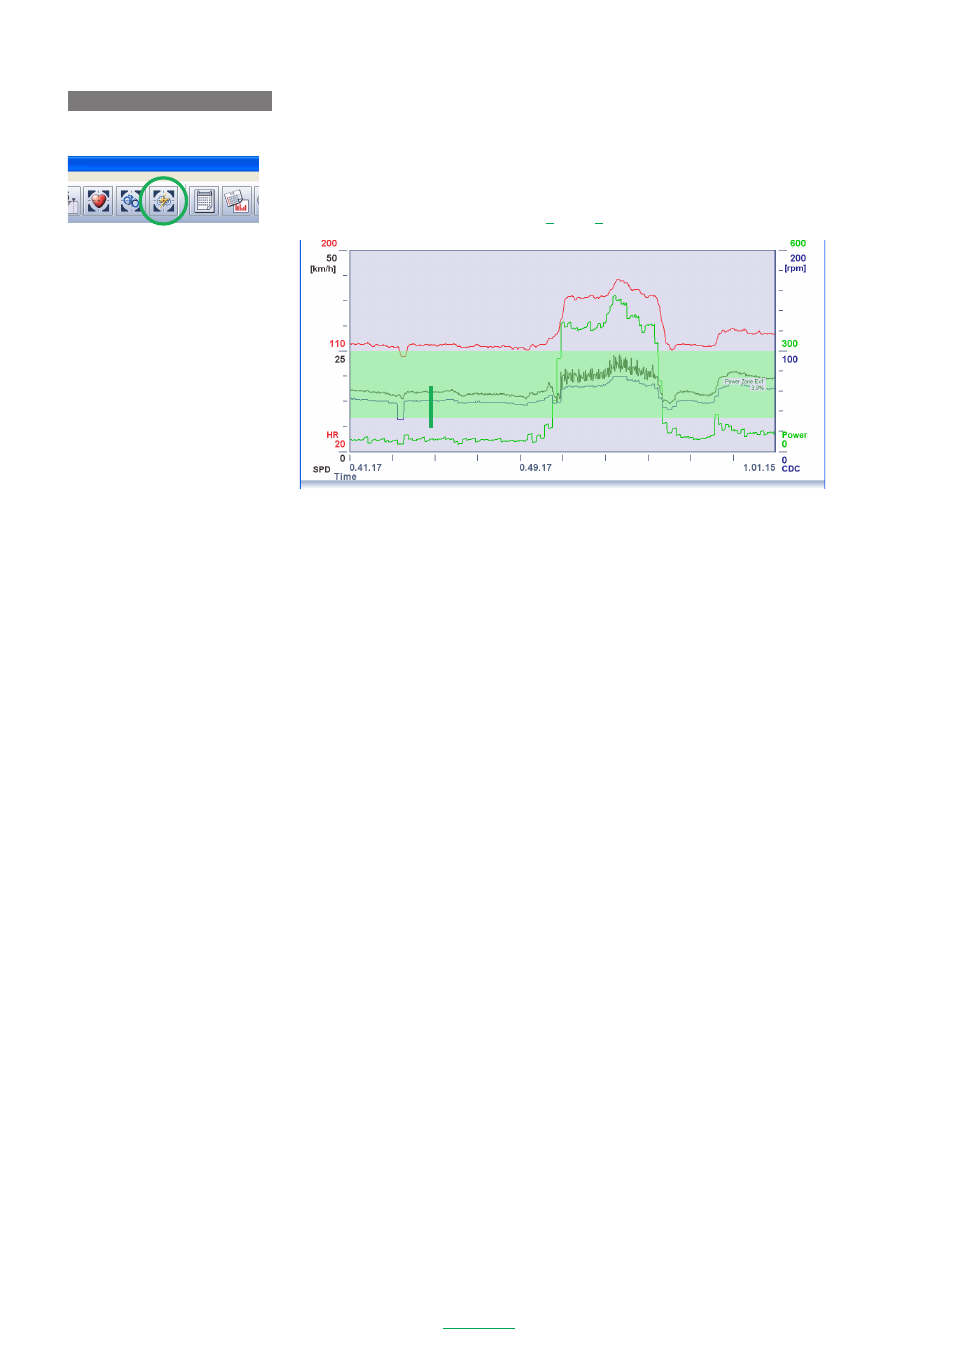
1. Click the
[Power Zone]
icon on the toolbar.
The power zone (Power zone EX1) appears in the Data Zoom Window.
NOTE
You can also display the power zone from
[View]
-
[Power Zone]
on the menu bar.
2. Each additional click on the
[Power Zone]
icon on the toolbar advances through the zones in order
from extra zone EX1 through EX10 as the power zone.
Power zone
The power zone can display a maximum of 10 zones. These are extra zones EX1 through EX10 which can be
set by e-Train Data Ver.3. It is possible to either display or hide each of the extra zones and to change the
zone range according to the user’s preferences, thereby making it easier to analyze the data. (Refer to the
When the user chooses to hide a zone, that zone is not displayed on the graph which instead advances to the
next zone.
The default settings of the Power extra zones are as follows:
EX1:
100 - 300 Display
EX2:
300 - 500 Display
EX3:
500 - 700 Display
EX4:
700 - 900 Display
EX5:
900 - 1100 Display
EX6: 1100 - 1300 Display
EX7: 1300 - 1500 Display
EX8: 1500 - 1700 Display
EX9: 1700 - 1900 Display
EX10: 1900 - 2100 Display
Power Zone
Power zone EX 1