Exploring the “on-line [e-train data ver. 3, Screen – CatEye e-TrainData™ Ver.3 [Power Unit Edition] User Manual
Page 49
49
e-Train Data V3
6. To stop, press the [START/STOP/ENTER] button of CC-TR100.
The
“On Line [e-Train Data Ver. 3]”
screen closes, and the data is transmitted to the PC.
IMPORTANT!
It may take a few minutes to complete the data transmission. Wait until it is completed to make sure all
the data has been transmitted.
7. The resulting data displayed in the main Data View screen of e-Train Data Ver. 3.
When the measurement result is displayed, press the START/STOP/ENTER button of the CC-TR100 to
complete measurement.
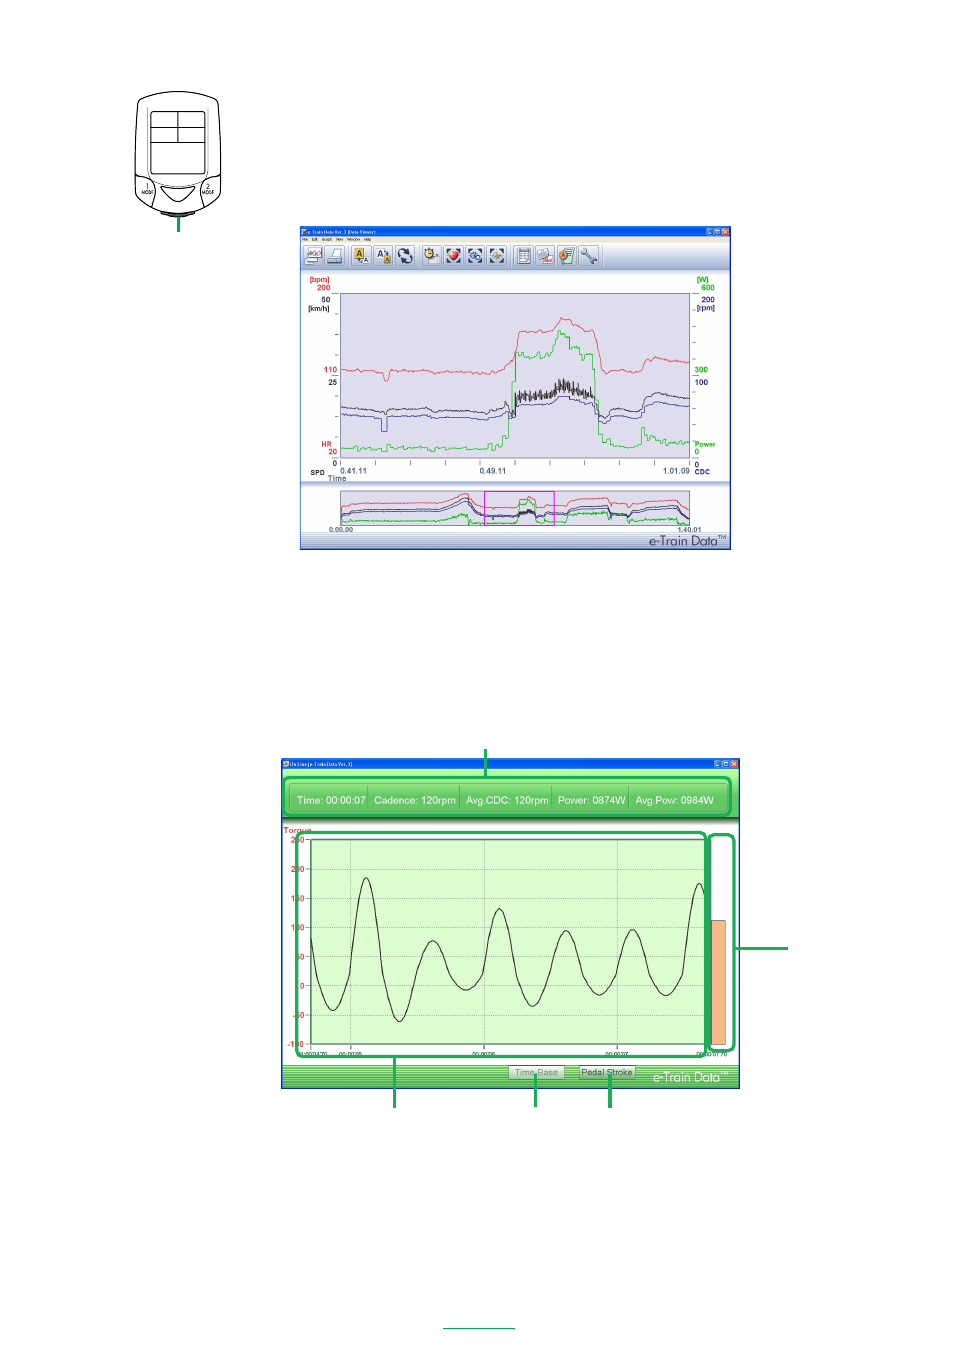
Exploring the
“On-Line [e-Train Data Ver. 3]”
screen
The
“On-Line [e-Train Data Ver. 3]”
screen consists of the Time dependent graph and Pedal position depen-
dent graph. The charts can be switched during measurement.
Time dependent graph
Displays a torque graph curve as a function of time.
The following functions are available in the Time dependent graph window:
Details ------------------- Displays the exercise duration, current cadence, average cadence, current power
and average power of the data that is currently measured.
Torque level ------------- Displays the current torque with a bar. The color changes according to torque level.
Torque transition graph -- Displays the torque curve.
Time Base --------------- Disabled as you are already in this window.
Pedal Stroke ------------ Opens the Pedal window.
Details
Pedal Stroke
Time Base
Torque Level
Torque transition graph
START/STOP/ENTER button
START/STOP/ENTER
LAP