CatEye e-TrainData™ Ver.3 [Power Unit Edition] User Manual
Page 21
21
e-Train Data V3
Toolbar
The following commands are available in the toolbar:
Data List ------------ Displays a list of downloaded data. You can open, delete, import and export data from
the list. You can also enter a training schedule in the calendar.
Print ---------------- Opens the print window to print the displayed data.
Zoom In ------------ Zooms in the designated section of the graph in the data zoom window.
Zoom Out ---------- Zooms out the designated section of the graph in the data zoom window.
Change Axis -------- Alternates the horizontal axis between time and distance.
Lap Data ------------ Displays or hides lap data.
HR Zone ------------ Displays a total of 10 zones in sequence. These are the heart rate zones 1 through 4
which have been set by CC-TR100 and the extra zones EX1 through EX 6 which can be
set by e-Train Data Ver.3. Each additional click on the icon advances through the target
zones in sequence. Each of the extra zones can either be displayed or hidden.
CDC Zone ---------- Displays a total of 5 zones in sequence. These are the cadence zone which has been set
by CC-TR100 and the extra zones EX1 through EX 4 which can be set by e-Train Data
Ver.3. Each additional click on the icon advances through the target zones in sequence.
Each of the extra zones can either be displayed or hidden.
Power Zone -------- Displays as the power zone, in sequence, the extra zones EX1 through EX10 which
can be set by e-Train Data Ver.3. Each additional click on the icon advances through
the target zones in sequence. Each zone can either be displayed or hidden.
Data Summary ----- Opens the window that shows a summary of the displayed data.
Data History -------- Displays all downloaded data in graph format.
Data Analysis ------ Displays the training zone of the displayed data in graph format.
Setup --------------- Opens the window to specify e-Train Data Ver. 3 settings.
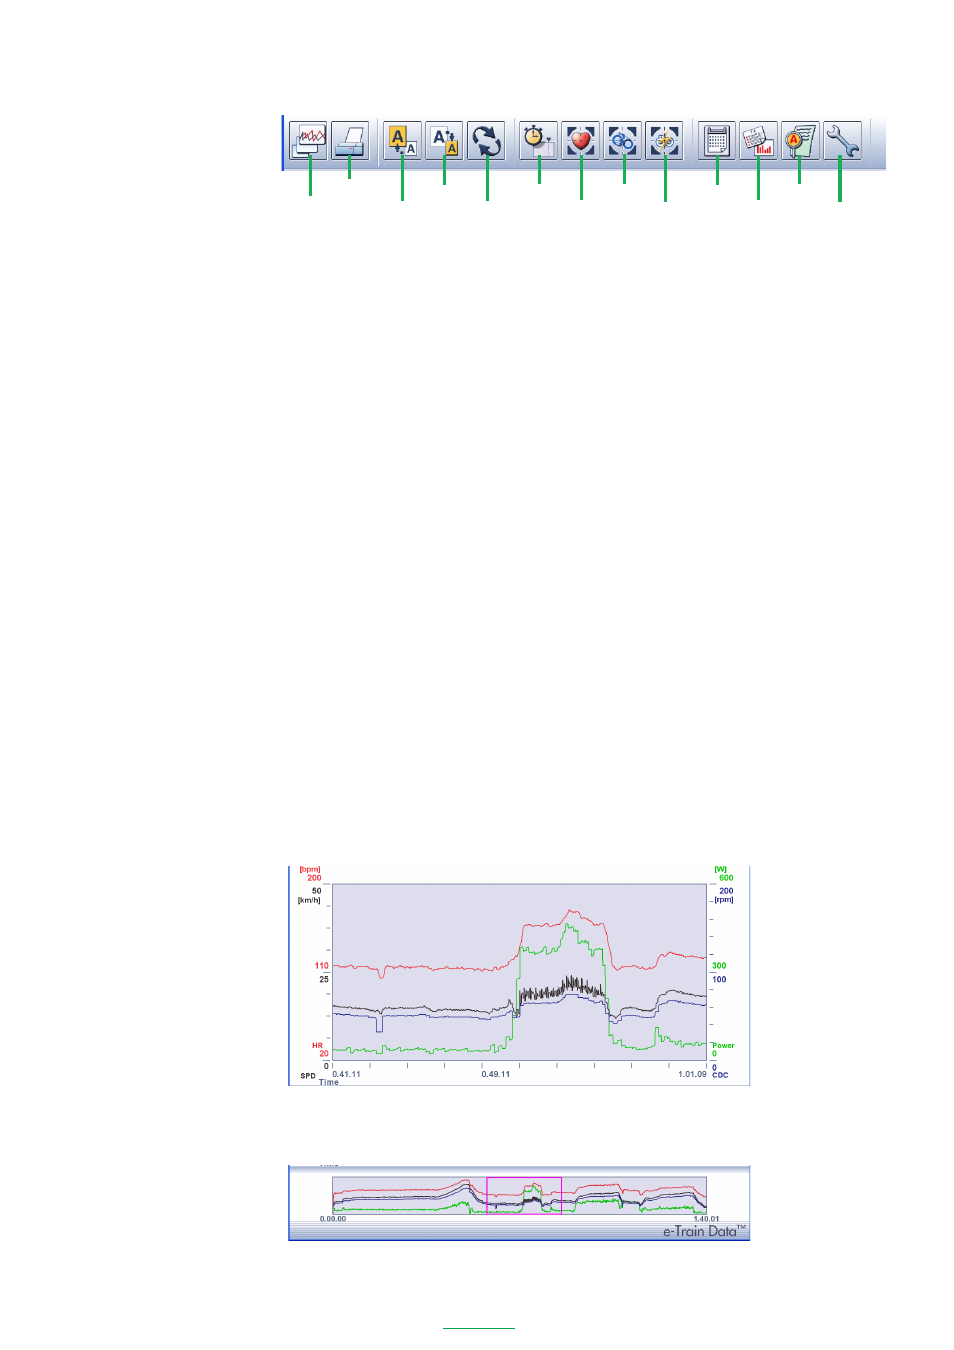
Data Zoom Window
Heart rate (red), speed (black), cadence (blue) and power (green) are displayed in line graphs (see page 46).
NOTE
If the power unit is not installed, the power line graph will not be displayed.
Click the
[Change Axis]
icon on the toolbar to alternate the horizontal axis between time and distance
Full data window
The entire data is displayed in graph format. The section of the graph within the graph cursor is enlarged in
the data zoom window. Moving the graph cursor will change the data in the data zoom window accordingly.
Zoom In
Data List
Change Axis
HR Zone
Power Zone
Statistics
Setup
Zoom Out
CDC Zone
Property
Analysis
Lap Data