6 line graph, 1 selecting data to be graphed, 6 line – Campbell Scientific PC400 Datalogger Support Software User Manual
Page 108: Graph -8, 1 selecting data to be graphed -8
Section 6. View
arrangement at any time. Windows can be tiled horizontally as non-
overlapping horizontal tiles by pressing the Tile Horizontally button or
choosing Window | Tile Horizontally from the menu. They can be tiled
vertically as non-overlapping vertical tiles by pressing the Tile Vertically
button or choosing Window | Tile Vertically from the menu.
A data window can be moved manually by clicking on the title bar and
dragging it to the desired location.
The data view window can be kept in front of a opened graph by selecting
View | Keep Data on Top from the menu.
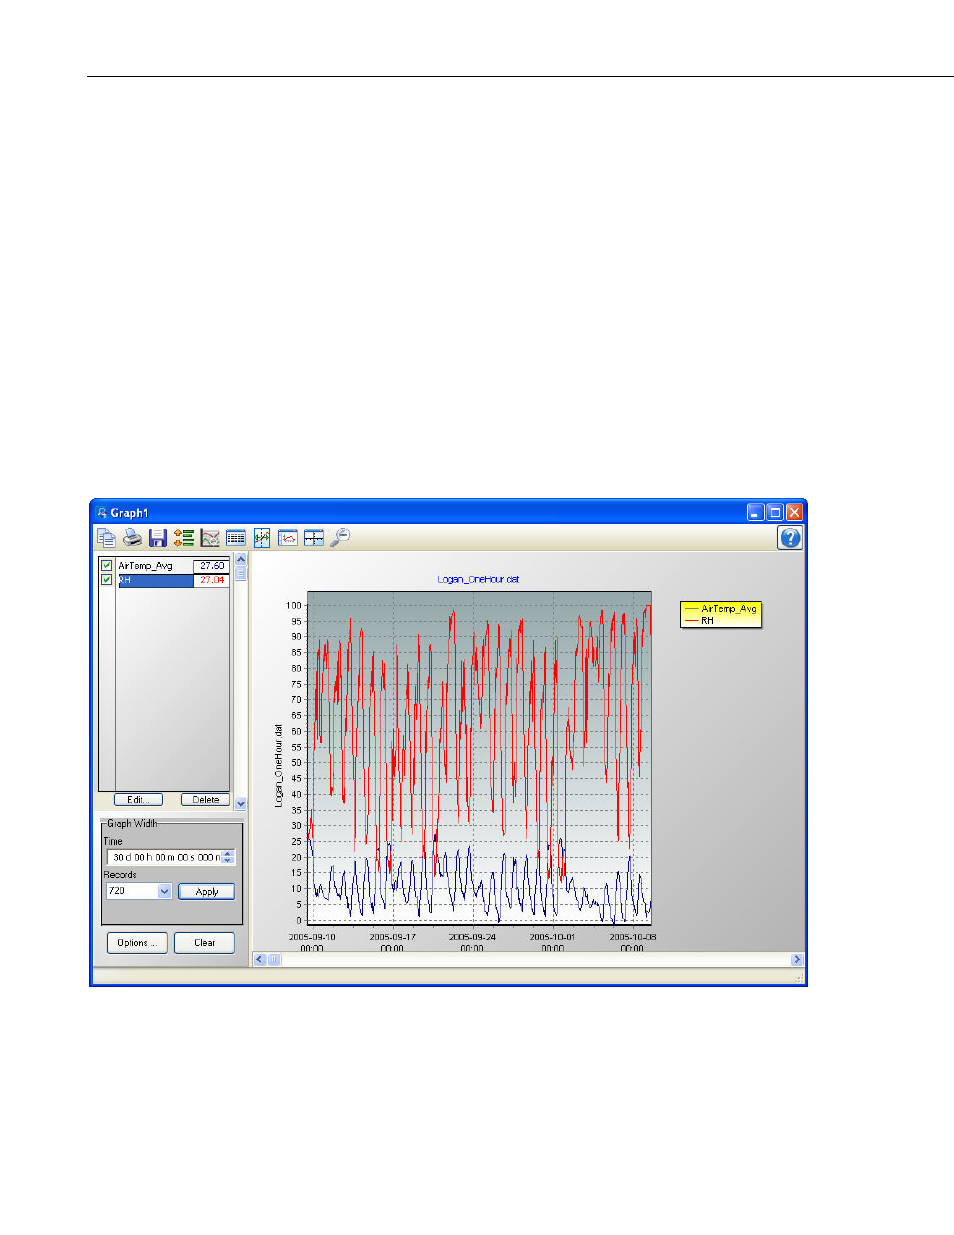
6.6 Line Graph
Once a data file is opened, data values can be displayed on a line graph. A line
graph is launched from a button on the View toolbar. From the Line Graph
screen, you can graph data values on the y-axis against their timestamps on the
x-axis.
6.6.1 Selecting Data to be Graphed
Data value(s) are added to a graph by clicking the column heading(s) in the
data panel with a single mouse click. The selection will be highlighted and
will automatically be added to the graph.
6-8