4 high sediment concentrations, High sediment concentrations, 3. relative scattering intensities of grain shapes – Campbell Scientific OBS500 Smart Turbidity Meter with ClearSensor Technology User Manual
Page 45
OBS500 Smart Turbidity Meter with ClearSensor™ Technology
0
20
40
60
80
100
120
140
160
180
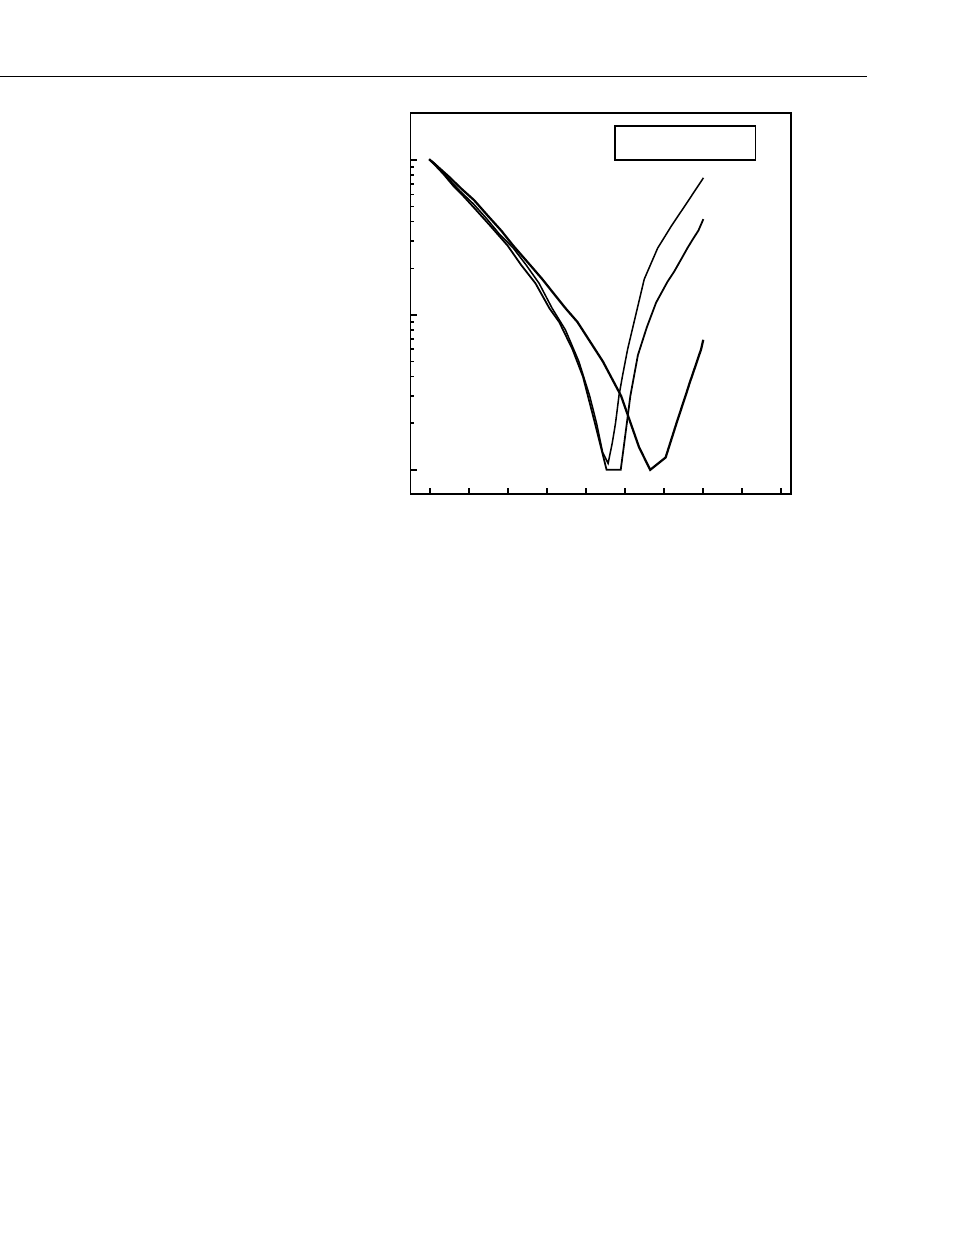
Scattering Angle
0.01
0.1
1
R
el
at
iv
e
Sc
at
te
rin
g
In
te
ns
ity
Cubes
Plates
Spheres
OBS-3+
FIGURE 8-3. Relative scattering intensities of grain shapes
8.4 High Sediment Concentrations
At high sediment concentrations, particularly in suspensions of clay and silt,
the infrared radiation from the emitter can be so strongly attenuated along the
path connecting the emitter, the particle, and the detector, that backscatter
decreases exponentially with increasing sediment concentration. For mud, this
occurs at concentrations greater than about 5,000 mg/l. FIGURE 8-4 shows a
calibration in which sediment concentrations exceeding 6,000 mg/l
cause the
output signal to decrease. It is recommended not to exceed the specified
turbidity or suspended sediment ranges, otherwise the interpretation of the
signal can be ambiguous. For example, a signal level of 2,000 mV (FIGURE
8-4) could be interpreted to indicate SSC values of either 3,000 or 33,000 mg/l.
Factory calibrations are performed in the linear region designated ‘A’ on the
graph.
35