Working with historical data reports, Adding statistics to historical data reports – Vaisala vLog 4.4 User Manual
Page 86
Viewing Reports and Statistics
80
Working with Historical Data Reports
Historical data reports display logger file information in a tabular format. You
must have at least one file inserted in vLog to view a report. To insert a file, see
Inserting Logger Files on page 60.
Printed reports can be customized to include specific text in headers and
footers, and both print and on-screen reports can be customized to display or
hide various statistics and column headings.
To view an historical data report for the currently-active graph:
1. Do one of the following:
• Select View>Historical Data Report.
• Press F6.
• Right-click anywhere on the graph and select View Historical Data
Report.
• Double-click anywhere on the graph.
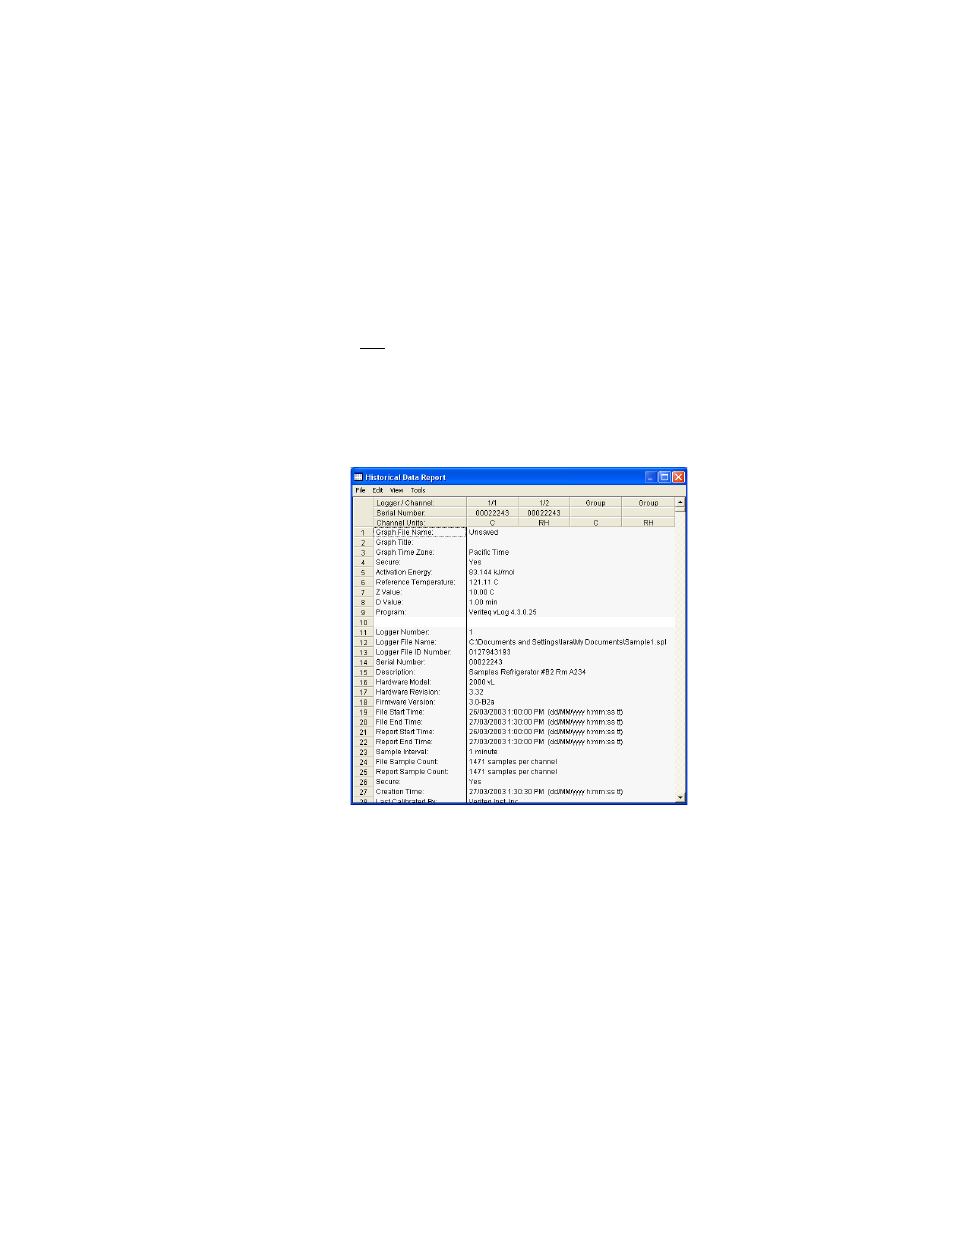
2. The Historical Data Report window summarizes the information in the
Graph file, as well as related information on the data loggers whose files
are inserted and the loggers’ setup parameters. You can customize which
headings and related statistics appear in reports. For more, see Adding Sta-
tistics to Historical Data Reports on page 80.
3. To print the report, from the Historical Data Report window, select
File>Print or press C
TRL
+P. To customize headers and footers on printed
Adding Statistics to Historical Data Reports
As you view or print a historical data report, you can also include statistical in-
formation derived from the logger file, including maximum, average and min-