Vaisala vLog 4.4 User Manual
Page 78
Working with Graphs
72
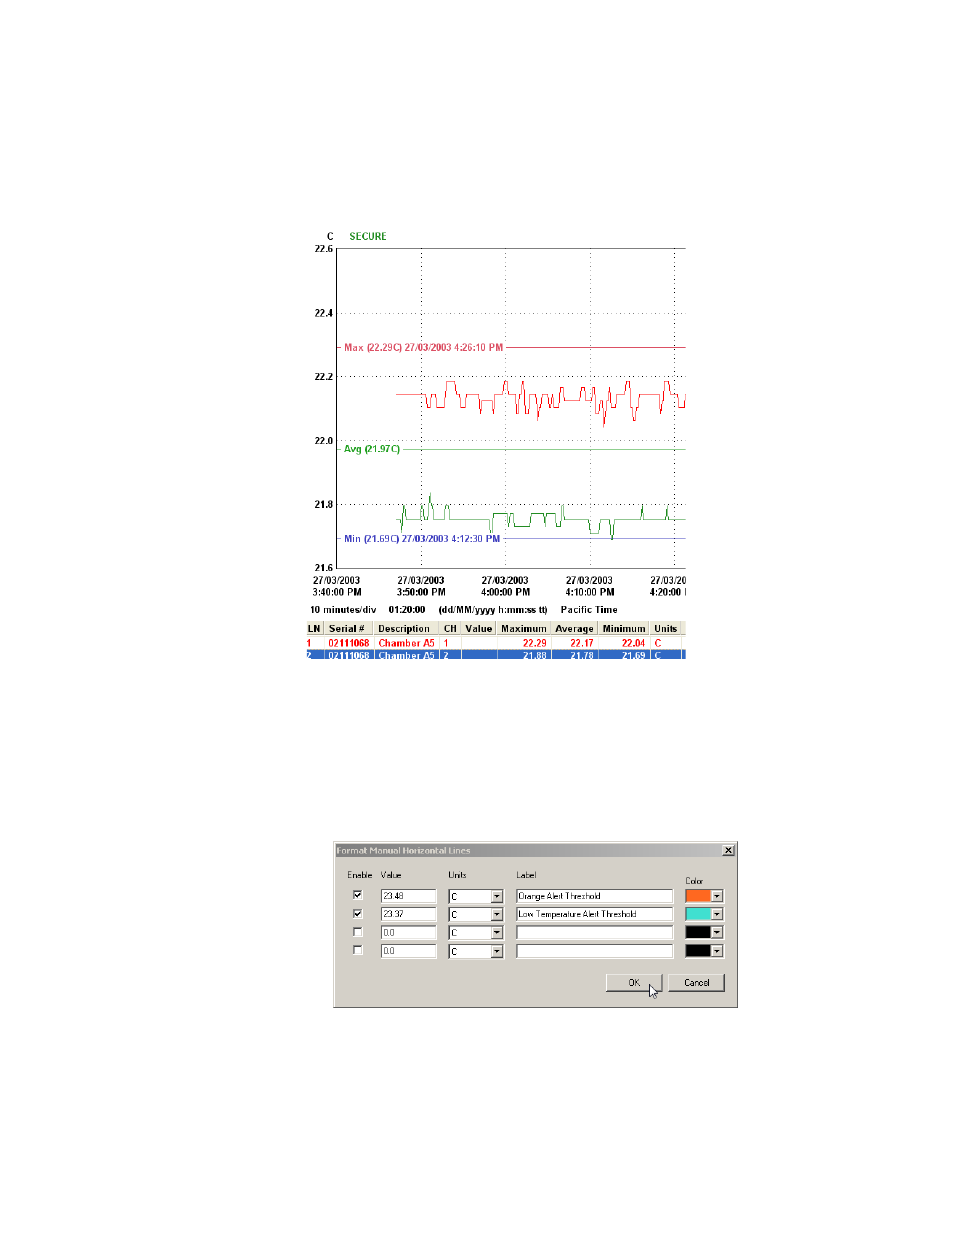
To add lines automatically:
• From a valid graph file, choose Format>Auto Horizontal Lines.
The Graph displays the maximum, average and minimum values in color-coded
horizontal lines. Maximum is shown in red, average is green and minimum is
blue.
If you zoom in on the Graph, the horizontal lines will change to show the max-
imum, average and minimum values over the selected time period.
To add lines manually:
1. From a valid graph file, choose Format>Manual Horizontal Lines.
2. From the Format Manual Horizontal Lines dialog, enter the value, label
text, color, and display units for the horizontal lines to add. You can do up
to four lines.
Lines appear on the Graph based on the colors, labels, units, and values you se-
lected.